iPartners inFocus - The Return of Inflation
A Lift In Global Inflation Rates Was Expected (By Michael Blythe, 11th May 2022)

iPartners inFocus - The Return of Inflation.pdf
iPartners inFocus - The Return of Inflation
A lift in global inflation rates was expected. The speed of the rise was not.
Central banks are responding to the global inflation spike. More rate rises are coming.
The RBA is part of the global story – markets are pricing an aggressive policy response.
What the market thinks is one thing. What the RBA can feasibly deliver is another.
The major handbrake to RBA aggression is the high level of household debt.
One of the standout changes in the economic landscape since the start of 2022 is the lift in inflation rates.
Some lift in inflation rates has always been expected as economies recovered from the pandemic-driven recessions. The RBA, for example, projected a few months ago that underlying inflation would edge higher from 2.6% in 2021 to 2¾% by the end of 2022.
What was not expected was:
The magnitude and speed of the acceleration in inflation. RBA forecasts, for example, were blown out of the water early in the piece. The QI underlying CPI printed at 3.7%pa!
The depth of price increases. The acceleration in price rises has proved broadly based across most CPI categories. Persisting with the Australian example, some 70% of the CPI basket is running at growth rates above 2½%pa (the midpoint of the RBA’s target band). And 60% of the basket is running above 3%pa (the top of the RBA’s target band).
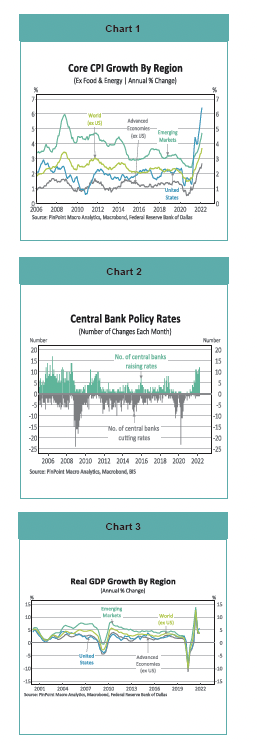
The spread of price rises across countries and regions. The inflation lift is evident in the advanced economies and the main emerging economies (Chart 1). Take your pick, inflation rates are running at multi-decade highs everywhere. But the inflation acceleration is particularly notable in the United States. And this US focus has magnified the fallout on global financial markets.
Until late 2021 many central banks had pencilled in another year on the sidelines. The regular mantra from the RBA, for example, was that the preconditions for a rate rise were unlikely to be in place before 2024.
But the dramatic turn in the inflation story was enough for many central banks to also shift direction on interest rates as well. The number of global central banks lifting rates is at the highest level since 2008 (Chart 2).
Common Themes
The global nature of the turn in inflation points to some common drivers. The inflation risks from these common drivers were well understood. But the persistence of these drivers was not expected. And the inflationary impulse from these drivers proved greater than expected.
The common drivers behind the lift in global inflation rates include:
i. The strength of post-pandemic recoveries
The pandemic and associated “lockdowns” hit growth rates hard in 2020. But, as bad as the fallout was, the recessions were shorter and shallower than expected. And the strength of subsequent recoveries exceeded expectations (Chart 3).
Demand ran ahead of supply, including for some key commodities like oil, and prices adjusted accordingly.

ii. The shift to “goods” from “services"
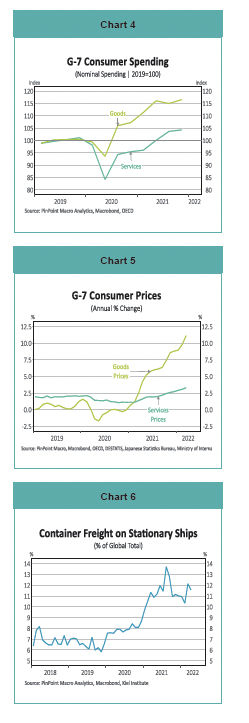
Lockdowns, by their very nature, limit the ability to spend on services. Consumers compensated by shifting spending to goods instead. The divergence in spending patterns was particularly marked in the major economies (Chart 4). Goods producers were taken by surprise by the shift in spending and goods prices rose quickly as a result (Chart 5).
Spending patterns were supposed to “normalise” as economies opened again. But this shift is taking longer than expected. Inflation from this imbalance has proved persistent as a result.
iii. Supply chain disruptions
The pandemic exposed the fragility of global supply chains. Demand-supply imbalances were accentuated. And shipping costs rose. Prices rose as a result.
Again, the expectation was that supply chains would re-establish quite quickly. But the process is taking longer than expected. Data shows, for example, that about 12% of the global supply of containers is sitting on stationary ships (Chart 6). This proportion is below peaks closer to 14% in 2021. But it is well above normal levels.

iv. The Russia-Ukraine War
The Russia-Ukraine war further boosted commodity prices and has created an oil price “shock”. The war is impacting on global food prices as well (Chart 7).
Common Worries
These drivers have contributed to the lift in global inflation rates. But what stands out about this list is that, ultimately, they should all prove temporary price influences. Spending patterns will normalise. Supply chains will be restored. Commodity price shocks normally unwind. What is more concerning are the indications that this initial inflation impetus is getting built into ongoing inflation rates. The clearest example is labour costs. Tightening labour markets are putting upward pressure on wages and labour costs across a range of key economies (Chart 8).
Australia: the same but different
Growth in Australian price measures have also lifted. The same common drivers have been at work. Inflation rates, as elsewhere, are at multi-decade highs.
What is different, however, is the magnitude of the shift.
Core inflation in Q1 2022 was running about 1¾% above its 2010-19 average (Chart 9). The deviation above pre-pandemic norms is much greater in most other economies.
Another difference is that some of the Australian inflation story follows directly from government actions designed to support the economy. RBA rate cuts and policies to encourage housing construction, for example, pushed new dwelling purchase costs higher. The housing sub-group made the largest contribution to the rise in the CPI over the past year (Chart 10). These pressures will recede as stimulus measures are unwound.

The labour cost story is also different in Australia. The wage response to falling unemployment is much more subdued than in other major economies (Chart 8). Australia has managed to generate some extra labour supply, via a rising labour force participation rate (Chart 11). There should be less concern about second-round effects building into ongoing inflation.
Inflation & the RBA
The word “big” (and all its synonyms) had a “big” workout in the analyses of the recent Q1 CPI readings. The increase in Q1 (2.1%) and the annual increase (5.1%) were the biggest rises since 1990 (excluding the introduction of the GST in 2000). The increase in the trimmed mean, or core inflation (3.7%pa), was the biggest rise since 2009.
The discrepancy between actual inflation and the market consensus (centred on 4.6%pa) was big. The discrepancy between the policy-relevant trimmed mean and the last published RBA forecast (of around 3¼%pa for Q1) was equally big.
The two big picture outcomes from the Q1 CPI were to refocus attention in the election campaign back to the cost of living. And to focus attention on the how the RBA would respond to the inflation shock.
The monetary policy choice often comes down to the path of least regret. Would the RBA’s greater regret be abandoning its target of full employment, which sits tantalisingly close? Or would it be allowing inflation to escape above the 2-3%pa target for an extended period?
RBA Governor Lowe fought a valiant rear-guard action against the pressures to lift interest rates. But the RBA has, reluctantly, now joined the global tightening cycle. The evolving policy debate is evident in the way RBA commentary shifted:
The rate rise condition that inflation is sustainably in the 2-3% target “will not be met before 2024” (Sep’21);
The Board is “prepared to be patient” (Nov’21), Governor Lowe notes a rate rise this year is “plausible” (Mar’22); and
Rising inflation has “brought forward the likely timing of the first increase in interest rates” (Apr’22).
The financial market debate on when the RBA moves was intense. In the end, however, it’s only financial market players that get excited about whether the RBA lifts rates one month or the next. The timing doesn’t matter for where the economy will be in 18 months’ time as rate changes run their course.
In the event, the RBA succumbed to the obvious and lifted the cash rate at the May 2022 Board meeting by 25pts to 0.35%. They’ve indicated that there is more to come.
For investors, the more important consideration is how far and fast the RBA moves.
The RBA in action
History is one guide once the RBA is out of the starting blocks. The “typical” rate rise cycle involves cumulative rate rises of 1-2% and is largely complete in 12-18 months (Chart 12).

Markets supposedly process a huge range of information in their “pricing”. So we can also appeal to financial markets for a view.
One approach is to look at bond yields. A 10-year bond can be thought of a series of daily interest rates (the RBA’s cash rate) plus a term premium for the risk of locking up your funds for ten years. Rearranging the equation reveals the market pricing for the cash rate end point (10-year bond yield less the term premium). Australian markets have an implied terminal cash rate for the current cycle of around 3% (Chart 13).
This outcome is conveniently in the middle of the 2½-3½% range for the neutral cash rate nominated by Governor Lowe.
Financial markets also have an aggressive time frame to get the cash rate up to neutral. The overnight indexed swap (OIS) market has the cash rate at 3% within 12 months.
What the market thinks is one thing. What the RBA can feasibly deliver is another.
The major handbrake to RBA aggression is the high level of household debt. Household debt is equivalent to a record 186% of household incomes. That’s about 120% of GDP. Australian household debt is at the high end of the range on any global comparison (Chart 15).

The high level of household debt is a perennial concern for Australian policy makers. This concern was in abeyance over the past couple of years because low interest rates mean debt servicing costs were very low. The debt service ratio is currently at 3.5% of disposable income, the lowest ratio since the early 1970s.
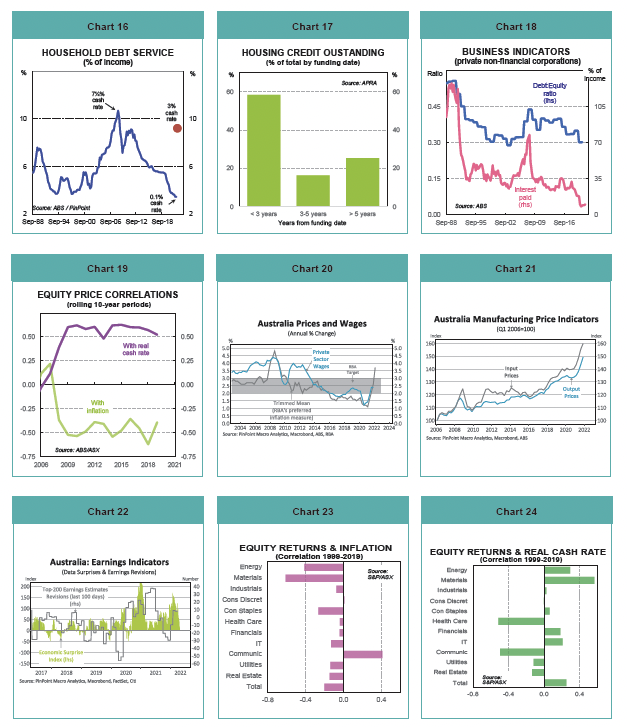
But that could change very rapidly in an aggressive rate rise cycle. Some sensitivity analysis shows a 3% cash rate would push debt servicing close to 2008 highs – a time of significant household stress (Chart 16). The monetary authorities are not aiming to lift household stress.
Housing dominates bank balance sheets. An aggressive rate response that damages housing affordability would lead to falling house prices. And that would be a financial stability risk. The monetary authorities are not aiming to generate risks to financial stability.
The consensus among economists is for a cash rate around 1½% by the end of 2023.
Rate rises potentially come with considerable “shock value”. Rate rises shouldn’t be a surprise given the intensity of the recent rates debate. But data from the banking regulator (APRA) shows that 75% of home loans outstanding (by value) were taken out in the past five years (Chart 17). The last rate rise cycle was twelve years ago. Most home-loan borrowers have never experienced a rate rise cycle.
That said, the same data means most home loans were taken out under the tougher lending standards impose by APRA since 2016. These are the borrowers who should be well placed to deal with higher mortgage rates.
Beyond households, balance sheets are in reasonable shape.
For business, debt:equity ratios are at the bottom end of the historical range. And business debt servicing costs are at record lows (Chart 18). For government, debt is high but debt serving costs are very low. Debt:GDP ratios are projected to decline over time.
The fiscal authorities have taken out some “insurance” against higher interest rates. The average duration of government bonds on issue now stands at over 7 years. They have essentially “locked in” low interest rates for an extended period.
Inflation, interest rates & equities
Rising inflation and higher interest rates will impact on many parts of the Australian economic story.
From an equity market perspective: share prices tend to be negatively correlated with inflation; and share prices tend to be positively correlated with the real cash rate (Chart 19).
Share prices should be a hedge against inflation as revenues and profits should rise. But higher market volatility and risk premiums dominate, leading to a negative correlation.
Share prices should weaken in a rising rates environment as profitability is impacted by weaker sales and higher debt servicing costs. But monetary policy tightening cycles are typically associated with strong economies, leading to a positive correlation.
The recent lift in inflation conceals some potential new themes that investors should monitor. It was only six months ago that the problem was trying to engineer a lift in inflation back into the target band. Underlying inflation ran below the RBA’s 2-3% target for most of the 2016-21 period (Chart 20).
So, beyond the current episode, the expectation is that inflation rates will subside and remain low. The “temporary” inflation drivers will eventually recede. And policy settings are moving in a way that will assist the return to low inflation.
There are a couple of lessons for equity investors from the extended period of sub-target inflation (and its likely renewal).
These lessons are:
- Businesses lack pricing power in a low inflation world. The growing gap between manufacturing input prices and manufacturing output prices is one example (Chart 21). The “magic” that makes this gap sustainable is productivity. So the need to deliver respectable productivity growth remains as strong as ever.
- Monetary policy in a low inflation environment can shift from a single-minded focus on inflation restraint. The evolution we were seeing before the Q1 inflation spike was a morphing towards more weight on “full employment”. This shift is evident in the correlation between positive data surprises and positive earnings revisions (Chart 22).
These factors have contributed towards the broad correlations between equity returns, inflation and interest rates discussed earlier. But correlations at the aggregate level conceal considerable variation between sectors (Charts 23 & 24). Some examples include:
- Financials. Returns are positively correlated with interest rates because rising rates normally mean a higher net interest margin and improved profitability.
- Infrastructure. Companies have high capital costs so should be negatively correlated with interest rates. But their revenue is often indexed to inflation.
- Consumer staples. Businesses are focused on just that: staples. Spending on such items is difficult to change, whatever may be happening with inflation or interest rates.

Meanwhile, I’m off to ask for a pay rise!
Disclaimer:
This report provides general information and is not intended to be an investment research report. Any views or opinions expressed are solely those of the author. They do not represent financial advice.
This report has been prepared without taking into account your objectives, financial situation, knowledge, experience or needs. It is not to be construed as a solicitation or an offer to buy or sell any securities or financial instruments. Or as a recommendation and/or investment advice. Before acting on the information in this report, you should consider the appropriateness and suitability of the information to your own objectives, financial situation and needs. And, if necessary, seek appropriate professional or financial advice, including tax and legal advice.


