iPartners inFocus - The RBA: ready, steady, go?
iPartners inFocus - what does high inflation mean for interest rates? (By Michael Blythe, 2nd March 2022)

iPartners inFocus - The RBA ready, steady, go?.pdf
The economic debate is now very much focused on inflation rates. And what higher inflation means for interest rates.
Inflation rates are responding to shifts in spending patterns from services to goods, supply chain blockages, higher food and energy prices, and tightening labour markets.
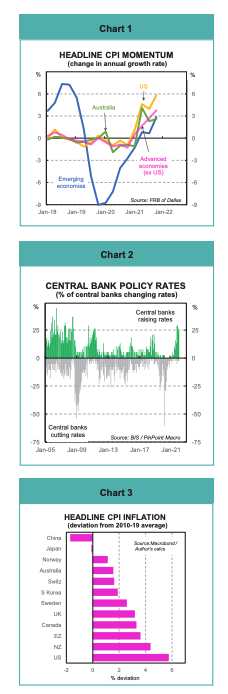
The lift in inflation momentum is broadly based (Chart 1). Particularly large momentum shifts are evident in the United States (up 6.2ppts), Eurozone (up 5.2ppts), United Kingdom (up 4.7ppts), New Zealand (up 4.5ppts) and Canada (up 4.0ppts). The lift in Australian inflation momentum is less marked (up 2.8ppts).
Not surprisingly, the policy bias held by global central banks has almost uniformly shifted to tightening. The net proportion of central banks lifting rates is at the highest level since 2010-11 (Chart 2).
Equally unsurprisingly, the most active central banks are those with the largest rises in inflation momentum. The RBNZ and the BoE have already lifted policy rates. The Fed and the BoC are expected to move soon. The ECB, RBA and SNB are holding back – for now.
These initial moves are not really tightenings. They are more about taking back some of the extreme monetary accommodation put in place to deal with the pandemic. Nevertheless, the question about how economies will respond to higher interest rates is an important one to consider.
From an Australian perspective, the main household exposure comes through the housing market. Higher rates increase debt servicing costs and reduce disposable income. Lower affordability could impact on wealth through lower house prices. Businesses are also directly exposed to any weakness in the housing market and construction more broadly. Lower disposable income also means business are exposed to a slowdown in consumer spending.
Australia: inflation & interest rates
Australian inflation rates have lifted:
Headline inflation is running at 3.5%pa – the first time inflation is running above the RBA’s 2-3% target in a sustained fashion since 2011;
Underlying inflation sits at 2.6%pa, the first print at the midpoint of the RBA’s target band since 2013-14.
But, as discussed in the January edition of inFocus (Australia in 2022: risks & issues), the Australian inflation experience is different. The acceleration is less marked than elsewhere. Inflation is running only a little above its pre-pandemic average (Chart 3). And wages are not responding to tighter labour markets in the same way they have in other countries.
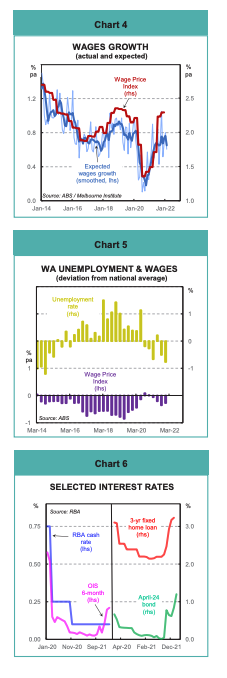
Inflation rates will probably prove “sticky” in the near term. But further ahead, spending patterns will normalise, supply chain pressures will recede and any acceleration in wages growth will be difficult to achieve. The nature of pay setting arrangements is the key. Public sector workers have pay increases capped at 2-2½%. Enterprise agreements that are locked-in for a number of years impose a wage inertia in the private sector. Expectations for wage rises remain contained (Chart 4).
The risk is that wages growth remains at the 2-2½%pa pace that prevailed pre pandemic. That wage performance was associated with a persistent undershoot of the inflation target.
These arguments certainly find favour with the RBA. Governor Lowe is insisting that the Bank will be “patient” when considering the timing of any interest rate move.
The RBA is also conducting something of a Grand Experiment at present. The unemployment rate, at 4.2%, is much lower than expected. The temptation is to push on to full employment and pursue an unemployment rate in the 3’s. Policy makers have quietly pointed out WA. Unemployment is already around 3½% and well below the national average. But wages growth (at 2.0%) is also below the national average (Chart 5).
Australia last had a sub 4% unemployment rate back in 1974. Gough Whitlam was Prime Minister, Richard Nixon had just quit as US President, Cyclone Tracy hit Darwin and some band called ABBA had just won the Eurovision song contest!
Nonetheless, the market has shifted. And the consensus now favours the RBA commencing a tightening cycle later in 2022. Some commentators favour as early as June.
Financial markets have to some extent taken the rates decision out of the RBA’s hands (Chart 6):
The Overnight Index Swap market (OIS), which provides an indication of where markets expect the RBA’s cash rate to go, are pricing in higher rates over the next six months.
The RBA was forced to abandon its target for keeping the yield on the April 2024 bond (the 3-year bond at the time) at 0.1%. This target reflected the RBA’s approach to quantitative easing (QE). That bond now yields 1.25%.
Commercial banks have already lifted some lending rates, such as fixed-rate home loans.
The direction of rates is one thing. But it is the level of rates that does the work on the economy.
Central banks will always stress that initial moves on the rates front are not policy tightening. Rather it is about removing some of the policy stimulus. But, once underway, the objective is usually about getting back to some neutral level of rates.
Fortunately, RBA Governor Lowe gave us some idea where the neutral rate sits in Australia back in November 2021. He put neutral as “at least 2.5%”. But, in best central bank fashion, immediately qualified that comment by adding “if not 3.5%”.
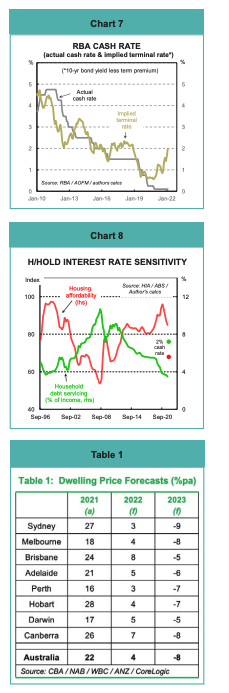
Financial markets also have a view on where the cash rate will end up. A 10-year bond can be thought of a series of daily interest rates (the RBA’s cash rate) plus a term premium for the risk of locking up your funds for ten years. Rearranging the equation reveals the market pricing for the terminal cash rate (10-year bond yield less the term premium). Australian markets have an implied terminal cash rate for the current cycle at around 2% (Chart 7). A cash rate of 2% looks about normal from a pre-pandemic perspective.
Households & interest rates
The starting point for any rise in interest rates is one of extremes (Chart 8). The share of household income used to service debt is near record lows. Housing affordability is at the high end of the range. But household debt is near record highs as a share of income.
Fears about the interaction of debt and lending rates is a long-running component of the Australian economic debate. Some sensitivity analysis shows why. If we take the market view of the terminal cash rate then, all else equal, lending rates should rise by around 2ppts:
a 2% rise in consumer borrowing rates would increase debt servicing costs by 3¾% of disposable income; and
a 2% rise in mortgage rates would reduce housing affordability by 20%.
The end points for debt servicing and affordability are marked by asterisks on Chart 8.
Most household debt is housing related. So the implications of higher interest rates for the housing market attracts most attention.
The transmission mechanism is straightforward. Higher mortgage rates reduce housing affordability. Lower affordability reduces housing demand. And less housing demand should mean lower dwelling prices.
These sorts of considerations are why the research teams at the major banks are uniformly projecting lower dwelling prices for 2023 (Table 1).
There are, however, also indications that households are prepared for the impact of higher interest rates.
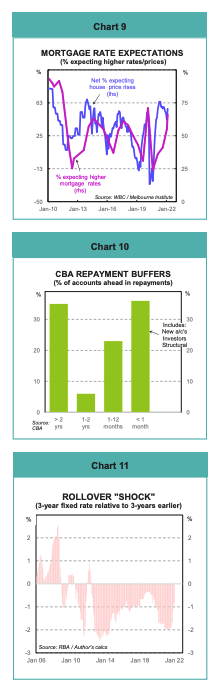
The potential for a “shock” with any rate move looks limited. Surveys show the proportion of consumers expecting higher mortgage rates is at the top end of the range (Chart 9). Those same consumers actually expect further rises in house prices over the next year.
The squeaky wheel gets the most oil they say. So the debate is always centred on borrowers. But one group will welcome higher rates – the savers. Australian households will remain net payers of interest. But higher interest income will provide some offset to higher mortgage payments.
Households have also taken advantage of the lengthy period of low interest rates.
Borrowers have taken out some “insurance”
The recent CBA results, for example, show that many borrowers kept repayments unchanged as mortgage rates fell. They built up a significant repayment buffer as a result. Some 34% of CBA borrowers are more than two years ahead in their repayments (Chart 10).
It’s also true that 37% of CBA borrowers have less than 1 month’s protection. But that share reflects new borrowers (who haven’t had time to build a buffer), investors (who want the tax benefits) and structural issues (those on fixed rates where additional payments are not allowed).
Borrowers have favoured fixed rate loans
The popularity of fixed rate loans has introduced some lags for when rate changes take effect. Returning to the CBA results again, some 47% of home loans outstanding at end 2021 were fixed rate (vs 23% at end 2020). Assuming recent borrowers took the popular 3-year option, they are “protected” against rate changes until late 2024.
Even after recent increases, fixed interest rates remain low from an historical perspective. Indeed, borrowers who took a 3-year fixed rate loan within the last three years can still refinance at a lower rate (Chart 11).
Borrowers have reduced non-housing debt
Borrowing outside of housing has been relatively restrained. Indeed households appear to have repaid a significant amount of debt over the past few years. RBA data shows other personal credit outstanding has fallen by $30bn or 18% since mid 2019.
Regulators and lenders have been cautious
The banking regulator, APRA, reports that 74% of home loans outstanding were originated under the tougher lending standards in place since 2016. And they have reinforced the process by lifting the interest rate margin required for assessing loan serviceability.
The buffer is “at least 3%” above the loan product rate. The implication is that the typical borrower should be well placed to deal with higher mortgage rates.
Business & interest rates
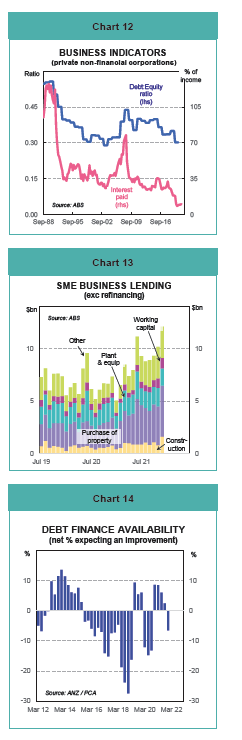
As with households, the starting point for any rise in interest rates is one of extremes (Chart 12). The share of business income used to service debt is near record lows (at 10%). The profit share of income is at record highs. And the debt:equity ratio is at the bottom end of the range (Chart 12).
The flow through from cash rate changes to business lending rates is less clear cut than for households. But, on a rough approximation, a 2% lift in the cash rate would boost the debt service ratio to 25-30% of business income.
Excluding large corporates like the miners who have a wider range of financing options, a large part of (SME) borrowing is property-related (Chart 13).
As noted, housing affordability is the first casualty of higher interest rates. And lower affordability is typically a precursor to reduced residential construction activity as well.
The return of students and migrants as Australia’s international borders re-open will provide some offset. But higher interest rates bring a significant risk of falling construction activity.
There are substantial second-round effects from changes in residential construction and sales. Input:output analysis shows that:
every $1 spent on residential construction generates $1.46 worth of spending elsewhere in the economy (notably retail); and
every $1m spent on residential construction generates 7 jobs on a full-time equivalent basis.
So a downturn in residential construction activity would be a negative in the outlook for consumer spending and the labour market.
Australian banks were relatively restrained in their commercial property lending in the post GFC period. The impairment and provisions experience with commercial property loans has been good as a result.
Nonetheless, the risk of losses for lenders in a rising interest environment would be expected to make them more cautious in their property lending activities.
The latest Property Council of Australia (PCA) survey shows a sharp lift in expectations for higher interest rates in the year ahead. A deterioration in debt finance availability is expected as a result (Chart 14).
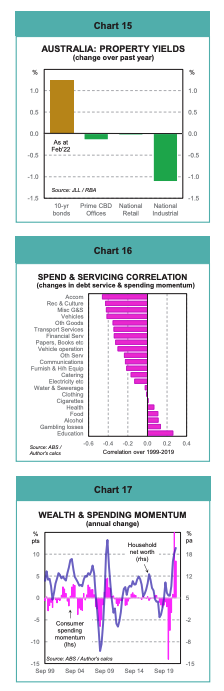
Commercial property yields are traditionally benchmarked against government bond yields as the risk-free asset. Higher bond yields carry a risk of reducing the attractiveness of commercial property as an asset class. The increase in Australian bond yields over the past year has coincided with a period where property yields have compressed (Chart 15).
For business, the impact of higher interest rates will also come through via the impact on consumer spending.
The transmission channels from higher interest rates to consumer spending are twofold:
a cashflow effect as rising debt servicing costs reduce household disposable income; and
a wealth effect as potentially lower dwelling prices reduce household wealth.
The change in the household debt servicing ratio is a leading indicator of consumer spending momentum. A lift in the ratio typically produces a slowdown in spending momentum over the following year.
For the statisticians, this linkage means that there is a negative correlation between interest rates and consumer spending. A deeper dive, however, reveals a significant variation in sensitivity across the major consumer spending categories (Chart 16). The main conclusions are:
Discretionary spending bears the brunt of any adjustment to higher interest rates. The largest negative correlations are in services like accommodation and recreation & culture. And in consumer durables like vehicles and furniture & household equipment.
“Essentials” spending is less affected. Spending on food, clothing, utilities, health have only a weak correlation with changes in interest rates.
Interestingly, spending on some of the “vices” like cigarettes, alcohol and gambling have a positive correlation with interest rates. Clearly a reflection of the financial stress generated by higher interest rates!
An unusually high level of savings hangs over the cashflow channel. The savings rate is near record highs. “Excess” savings stands at around $240bn. This excess is equivalent to 17% of annual household disposable income and 22% of consumer spending. This pot of cash can be used to moderate the cashflow impact of higher interest rates.
Housing is the largest part of household wealth, accounting for 53% of total assets. And changes in wealth can influence our ability and desire to spend. The rapid increase in net worth in recent years, courtesy of house price inflation, is associated with a lift in consumer spending momentum (Chart 17).
The RBA estimates that a 10% reduction in housing wealth cuts consumer spending by ¾% in the short-run and 1½% in the long-run.
Financial markets & interest rates
The RBA exerts a powerful interest rate over shorter-term bond yields in Australia. A higher cash rate does mean shorter-term interest rates out to three years should also rise.
Of course, markets have not waited for the RBA to move. And 3-year bond yields, a key input into loan pricing, are already higher (Chart 18).
One risk to watch is that rising short-term bond yields have proved difficult to sustain (as in 2014 and 2017/18) unless validated by the RBA (as in 2009/10).
The short end is anchored by RBA policy settings. So movements in longer-term rates will ultimately determine the slope of the Australian yield curve. In turn, the long end will be heavily influenced by US Treasury’s.
The Fed is set to move sooner and faster than the RBA. The likelihood is that the Australian yield curve will steepen initially. And then flatten when the RBA joins the global tightening party.
Interest rates are an input into currency pricing as well.
Currencies are a relative price. So relative interest rate differentials, like the cash rate gap, are a useful guide to currency direction (Chart 19).
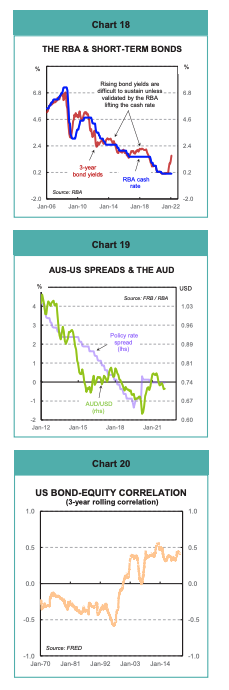
With the Fed out of the starting blocks first, the cash rate gap will widen in favour of the USD. And, all else equal, the AUD would weaken. The RBA would no doubt be happy with that outcome. And, at the margin, the lure of a lower currency may add to the reluctance of the RBA to follow the global rates cycle.
Again, as is the way of markets, some of that potential downshift in the Aussie is already in place.
A common belief is that there is a negative correlation between bonds and equities. This belief lies behind the idea that bonds are a safe-haven in times of market turmoil and a useful hedge for equities.
A negative correlation did hold sway for much of the twentieth century. But the relationship broke down around the turn of the century and the correlation is now quite positive (Chart 20).
Those that have investigated the shift note that correlations tend to rise during recessions. And they point to the long-running impact of pervasive shocks like the global financial crisis and COVID-19. A general rise in uncertainty pushes in the same direction. And the resort to unconventional monetary policies that target bond yields directly has muddied the waters.
Monetary policy is not just about interest rates any more. The big central banks have sizeable balance sheets courtesy of their quantitative easing (QE) policies. These balance sheets need to be shrunk back towards more normal levels. Concerns about the process are a key factor behind the rise in bond yields around the world. And there are flow-on’s to other asset markets as well.
Commodity prices are an example. The global activity backdrop is generally supportive of commodity prices. But the end of QE could generate some downward price pressures (Chart 20).
When the monetary authorities change course they always do so with the best of intentions. They want to head off whatever risks are building over the horizon.
The problem lies with calibration. There is always a risk of going too far and making a policy mistake. The very high interest rates in the late 1980’s, for example, helped Australia join the low inflation club. But arguably those rates also deepened and prolonged the early 1990’s recession.
Meanwhile, I’m off to fix my home loan and pick up a carton of beer!
Disclaimer:
This report provides general information and is not intended to be an investment research report. Any views or opinions expressed are solely those of the author. They do not represent financial advice.
This report has been prepared without taking into account your objectives, financial situation, knowledge, experience or needs. It is not to be construed as a solicitation or an offer to buy or sell any securities or financial instruments. Or as a recommendation and/or investment advice. Before acting on the information in this report, you should consider the appropriateness and suitability of the information to your own objectives, financial situation and needs. And, if necessary, seek appropriate professional or financial advice, including tax and legal advice.


