iPartners inFocus - The Economy, Markets and Alternatives
iPartners inFocus - The Economy, Markets and Alternatives
Michael Blythe Considers The Impact Of The Economy And Market Volatility On Alternatives (By Shannon Turnbull, 22nd December 2021)

iPartners inFocus - The economy, markets and alternatives.pdf
• Most forecasters expect reasonable economic outcomes in 2022 – but with downside risks.
• Reasonable growth outcomes should underwrite respectable corporate metrics.
• Interest rates should remain low – although off their emergency lows as inflation concerns lift.
• It’s a recipe for financial market volatility.
• Alternatives tend to march to a different beat – industry/company specifics matter as much as the broad economic backdrop.
Alternative investments are often seen as “exotic” or “unconventional”. But in reality they operate in and respond to the same economic and market drivers as more traditional investments.
The key themes driving investment decisions in the year ahead are expected to include:
• reasonable rates of economic growth that should see the advanced economies regain pre-pandemic trends;
• persistent supply bottlenecks and rising input costs sustaining inflation and creating challenges for policy makers;
• central banks removing some of their extraordinary policy stimulus as a result; and
• risks that remain skewed to the downside.
Reasonable growth outcomes should underwrite respectable corporate metrics. The pandemic impact, however, should drive sizeable variations between countries and sectors. Inflation pressures should mean higher interest rates (although still low by any longer-run comparison). Fiscal settings will be pushed and pulled by the need to wind back short-term support measures and ramp up longer-term growth drivers. Geopolitical issues will continue to play out.
It’s a recipe for market volatility.
The global backdrop
Forecasts for the global economy come with a tinge of optimism. But the major forecasting agencies fall over themselves to qualify that optimism. The most common descriptors of the global outlook include incomplete, uneven, unbalanced, uncertain and unequal.
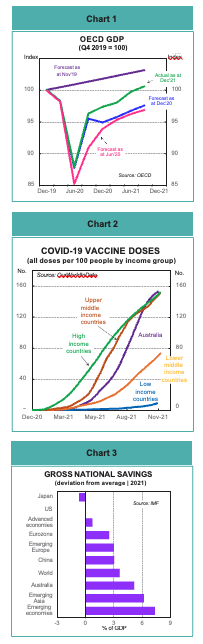
The optimism is understandable. The drop off in OECD economic activity in 2020 was less than feared. And the recovery in 2021 was much stronger than expected (Chart 1).
The OECD puts global GDP growth at 5.6% in 2001.
That solid result is backed up with respectable growth rates of 4.5% in 2022 and 3.2% in 2023.
High vaccination rates are allowing the advanced economies to re-open and activity is responding. Still expansionary policy settings are helping. And a return to more normal levels of savings and spending by consumers and businesses should sustain momentum. National savings in many countries and regions is well above average levels (Chart 3).
The qualifications to that growth optimism are also understandable. The pandemic in all its forms is driving a wedge between countries and sectors. Countries/regions with low vaccination rates are set to underperform (Chart 2).
And the more people-intensive services sectors could follow suit. Beyond the pandemic, supply constraints, inflation and potential for policy errors are key concerns. Supply constraints come from a number of sources.
A dramatic shift from spending on services to goods caught manufacturers short. The rapid recovery post lockdowns saw demand run ahead of supply, further exacerbating the problem. Shipping bottlenecks and a shortage of computer chips (Chart 4) turned the screws further. The global car industry was particularly affected. Lower auto production has weighed heavily on countries like Germany, Mexico and Japan.
As any economist will tell you, prices will rise when demand runs ahead of supply. The inflationary impact was accentuated by higher food and energy prices.
As any market participant will tell you, higher inflation rates mean central banks will have to start lifting interest rates. Financial markets are pricing in higher policy interest rates for 2022. In the US, for example, markets are pricing in a 45% chance of a 25-50bpt rise in the fed funds rate by mid 2022 (Chart 5).
Inflation is proving more persistent than initially thought. So it is hard to argue against the consensus favouring rate rises. But we should also beware the extreme rates pessimism.
Recovery should mean a return to a more normal distribution between spending on goods and services. Supply chains will rebalance. Shipping costs and energy prices have retreated from recent peaks. Inflation rates should peak in early 2022 and then ease back. Inflation rates in OECD countries are projected to slow from 5% at end 2021 to 3½% at end 2022. Policy makers can afford to be “patient” against that backdrop.
Beyond inflation, key issues remain the potential risk to Chinese growth from any disorderly correction in the Chinese property market, electricity supply problems in China, lingering issues with the US debt ceiling and risks to do with trade and other geopolitical issues.
The Australian economy
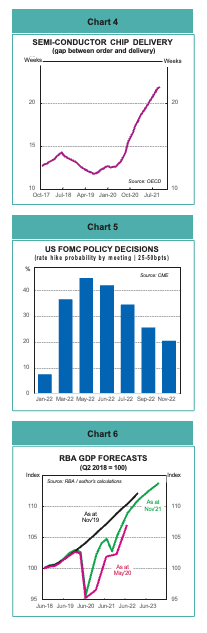
The Australian outlook closely matches the global backdrop. The pandemic drove a number of potholes into the Australian growth trajectory. But reality was less bad than feared
(Chart 6). And the forecasts are encouraging.
The economy grew by around 4½% in 2021. And the projections have a solid 5% growth in 2022 before easing back to 3% in 2023. The unemployment rate should decline further against this backdrop. The RBA expects unemployment to sit at 4% by end 2023.
The main growth drivers are the bounce back from recent lockdowns in the big States, a high vaccination rate (Chart 2), a reduction in household saving driving a consumption boom, a recovery in business capex and ongoing policy support.
The savings rate in Australia is near record highs (Chart 7). On some calculations, “excess” savings stands at around $240bn. This excess is equivalent to 17% of annual household disposable income and 22% of consumer spending. This “rainy day” money is potentially a very powerful support to the overall economy in the year ahead.
Supply chain issues are just as prevalent in Australia as elsewhere. Lockdowns meant that spending on “services” collapsed and the focus shifted to “goods”. A construction boom pushed up building materials prices. Higher food and energy prices added to the inflationary impetus from this mix of drivers. As in many other countries, goods inflation ran well ahead of services inflation as a result (Chart 8).
What is different about the Australian inflation experience is that the acceleration is less marked than elsewhere. And wages are not responding to tighter labour markets the way they have in other countries. Nonetheless, the market has shifted. And the consensus now favours the RBA commencing a modest tightening cycle later in 2022. RBA Governor Lowe, however, is prepared to be patient.
He has questioned market pricing noting “the latest data and forecasts do not warrant an increase in the cash rate in 2022”. As in other countries, he expects a rebalancing of spending and the resolution of supply issues to take some of the pressure off prices. Especially in an environment of weak wages growth. Interest rates seem set to remain low.
Australia has been able to weather the risks emanating from the Chinese economy and policy, as well as skittish financial markets. But these risks will persist.
Alternatives against an uncertain backdrop
Financial market volatility may be a theme for the year ahead. Investors should remember, however, that returns from alternatives tend to march to a different beat.
In particular, the correlation between Australian credit and the more traditional asset classes is quite low (Chart 9):
• The correlation between Australian credit returns and a selection of equity market returns, for example, ranges from 0.05 to 0.20 over the 1990-2016 period.
• The correlation with Australian listed property is also at the low end of the range, at 0.21.
The exception is fixed income, where correlations are high (0.96 for Australian fixed income, for example).
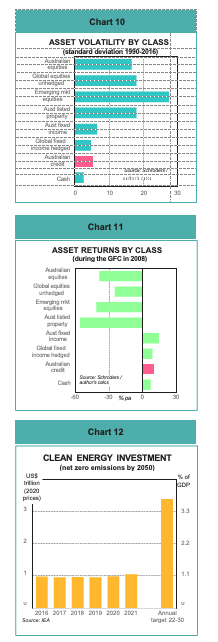
The other difference with alternative asset returns is their relatively low volatility (Chart 10). The volatility of returns on Australian credit sits well below equities and property. Volatility, though, is similar to fixed income.
One implication is that incorporating alternatives into an investment portfolio could reduce overall volatility.
One note of caution. Period averages can conceal the cyclical component of returns. It seems that Australian credit outperforms during periods of downside financial market stress such as the global financial crisis in 2008 (Chart 11).
But credit underperforms during equity bull markets such as the dot.com boom of the late 1990s.
Climate change as an alternative investment opportunity
A recent iPartners inFocus piece looked at “The weather, the economy and markets”. What stands out in that analysis is the large price tag associated with climate change remedies. Dealing with the issue will require a big increase in physical assets, efficiency measures, R&D and a need for finance.
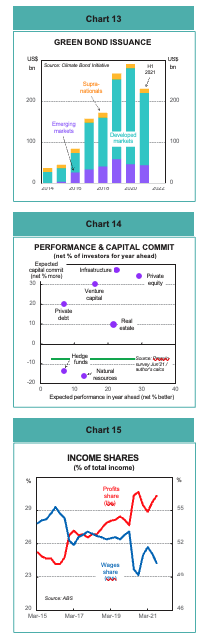
Opportunities for investors in alternatives lie across all these categories. IEA estimates put the required global investment in the clean energy space at US$3½trn per annum between 2022 and 2030 (Chart 12). This calculation gives one example of the possibilities.
These sorts of long-life, regular-cash-flow assets are likely to be appealing to pension funds, banks, private credit, venture capital and equity investors. The funding of these assets will also provide opportunities in the fixed income space. Green bonds are one example. Cumulative issuance of green bonds exceeded US$1trn at the end of 2020 (Chart 13).
Investor views
Preqin, a research organisation that focuses on the alternative assets market, conducts regular surveys of institutional investors. Their latest survey (mid 2021) shows global institutional investors have a positive view on the alternatives space. They expect to allocate more capital to all categories over the year ahead. And they expect better returns than in the previous year across private equity & venture capital, infrastructure, real estate and private debt (Chart 14).
Alternatives specifics
Alternative investments may respond to the same economic and market drivers as more traditional investments.
But sector-specific and country-specific factors are at least as important.
These factors are many and various. From an Australian perspective, some of the more important ones for the next year include:
(i) Private equity & venture capital
The key economic fundamentals behind Australian private equity and venture capital look favourable overall:
• An improving economic backdrop, likely reduction in supply-driven price pressures and restrained wages growth is favourable for corporate profitability (Chart 15).
• The likely continuance of the low interest rate environment is favourable for the debt-driven strategies often employed in private equity.
• The same low interest rates should mean the pursuit of yield and capital gains continues. It’s a backdrop that should be favourable for M&A activity and IPOs.
• The pandemic and associated lockdowns has damaged some companies. The likely withdrawal of government support as the economy recovers could expose this damage. There should be opportunities for private equity restructuring and reorganising.
• The pandemic has also accelerated the adoption of technology as consumer spending trends changed and employees started working-from-home. These trends should provide opportunities for venture capital.
(ii) Hedge funds
Hedge funds cover a plethora of alternative investments. Distressed securities, global macro, event-driven, long-short, emerging markets, merger arbitrage and so on. As such, it is difficult to comment on market drivers.
Economists typically retreat to the broad fundamentals.
And as a broad generalisation hedge funds fare better in
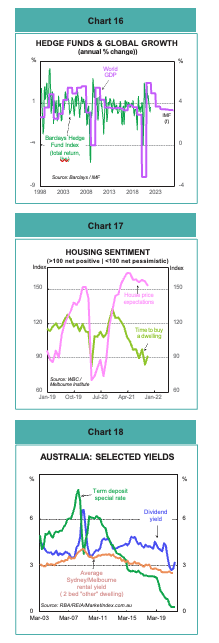
“good” economic times. The total returns from the Barclays global hedge fund index, for example, tend to cycle in line with global GDP growth (Chart 16).
(iii) Real estate
Low interest rates, government support, the pursuit of yield and capital gains have supported residential real estate and proved helpful for parts of commercial real estate as well.
The usual array of forces will be at work on dwelling prices over the next few years:
• Rising prices are denting affordability and buyer sentiment. Views on whether now is a “good-time” to buy a dwelling have fallen as prices rose (Chart 17).
• But the modest rises in interest rates expected should mean that servicing costs remain manageable.
• Falling affordability points to less first-home-buyer interest but rising asking rents and ongoing capital gains are attractive to investors (Chart 18).
• Falling unemployment also helps serviceability and limits the risks from loan arrears/defaults.
• Macroprudential policies are in play to cool the market. But expected house price momentum (Chart 17) means that even the regulators anticipate only a modest impact on residential real estate.
• Overhanging all this is the likely return of migrant and student housing demand as Australia’s international borders reopen.
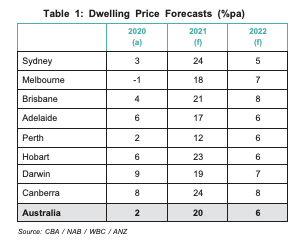
The consensus among economists at the major banks is that Australian house prices will rise by 20% in 2021 and a further 6% in 2022 (Table 1).
To put in the standard disclaimer, commercial property is more cyclical and volatile than its residential counterpart.
The demand for commercial space generally rises alongside growth in the economy. And, as noted earlier, the consensus is that the Australian economy will recover quite strongly in the year ahead.
From an industry perspective, the stronger segments should be consumer spending, business capex, exports and imports. These drivers should deliver solid jobs growth.
These outcomes neatly cover most of the commercial property sector.
Economist always like to say “this time is different”.
And certainly there is an expectation that the pandemic will leave some longer lasting influences on commercial property.
The expectation is that changed consumer spending patterns will impact negatively on the retail segment. And changed working preferences will impact negatively on the office segment.
Economists also know that most of the time things aren’t different - history repeats. And there are grounds to avoid some of the more extreme negativity that surrounds commercial property.
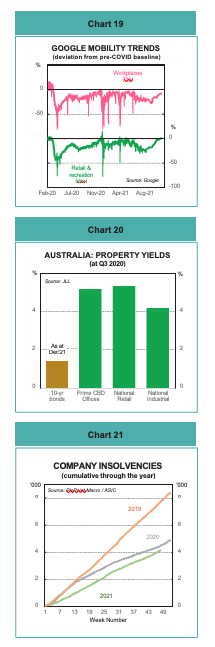
Data on mobility trends from Google location history (Chart 19) is showing some trends to watch closely:
• The data shows that consumers have returned to the shops. At the height of the shutdown in H2 2021 “visits to retail & recreation places” were 26% below normal (down 43% in Sydney and Melbourne). By December 2021 that shortfall had completely disappeared.
• The data shows that a return to “workplaces” is underway. But the process is incomplete. And the return is slower than after earlier lockdowns. By December 2021 workplaces were still 8% below pre-pandemic norms.
There is also a lesson in the mathematics. There may be fewer employees in the office at any time. But each employee will require more space. The Building Code of Australia sets the minimum floor space per worker of 10m2. Experts put actual floorspace at around 12-14m2. Some fiendishly complicated calculations by the Institute of Place Management conclude that a space of 16m2 is needed to meet a 1.5m social distancing requirement.
The bottom line is that (assuming a pre-pandemic space of 12m2) only 75% of employees could return to the office.
A higher return rate would actually require more office space, not less as generally feared.
Commercial property yields are traditionally benchmarked against government bond yields as the risk free asset.
Even after recent increases, bond yields are low, maintaining the attractiveness of commercial property as an asset class (Chart 20).
(iv) Private debt
Many of the key economic fundamentals favouring private equity also look favourable for Australian private debt.
The drivers of revenue and debt servicing look supportive overall.
The wave of bankruptcies expected to follow the pandemic and associated shutdowns failed to materialise (Chart 21). Government support measures and low interest rates helped. This assistance will diminish during 2022. But the outcome does speak to some underlying resilience in Australian business.
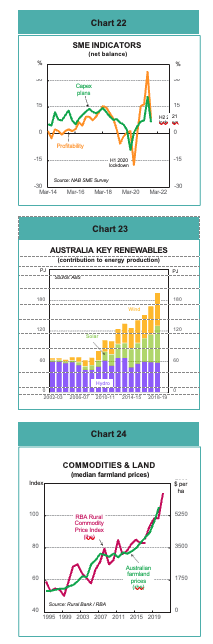
It’s also an environment where business capex plans look relatively robust. Especially in the SME space. Business surveys show positive expectations for SME profitability and capex (Chart 22). These plans took a hit during the most recent lockdown. But it was a noticeably more resilient outcome than in the early 2020 lockdown.
This capex task comes with a funding requirement. Traditional bank lending is constrained by a combination of tighter regulations and natural bank conservatism.
Bank business lending overall is relatively subdued.
Within the total, lending to big business grew by 5.3% over the past year. But lending to small and medium-sized businesses grew by only 1.5% over the same period. There is an opportunity for alternative lenders to fill the gap.
(v) Infrastructure
Fiscal policy is a risk in the general economic outlook.
Too aggressive a withdrawal of pandemic stimulus measures could weigh on the recovery. Australian policy makers understand the risk. We should see short-term stimulus measures increasingly replaced by longer-term growth supports. Chief among these is spending on infrastructure.
Any additional infrastructure spending will build on a solid base of projects that pre-date the pandemic.
Nevertheless, estimates by the G-20 Global Infrastructure Hub show a sizeable shortfall between needed infrastructure investment and current spending trends. As noted earlier, clean energy is a key component of this shortfall. Renewable energy output is still a relatively small share of the total.
But it is growing rapidly (Chart 23).
According to Climate Bond Initiative (CBI), almost half of the projects in Infrastructure Australia’s Infrastructure Priority List meet international investor definitions of “green”. Expect infrastructure offerings to have an increasingly green tinge.
(vi) Natural resources
Australia is a major commodity producer and exporter.
Non-rural commodities dominate. But they are largely the preserve of big companies. The opportunities for alternative seem to lie more in the rural space.
Bank lending data makes the point. Some 83% of bank lending to agriculture goes to SME’s. In mining, the proportion is only 8%.
Prospects for the rural sector are very encouraging. Exceptional seasonal conditions are coinciding with a period of elevated rural commodity prices. The government forecasting agency, ABARES, puts the value of rural production at a record $78 billion in 2021/22.
Australia is on track to produce the largest volume of agricultural commodities ever recorded.
Trade disputes with China are a threat to some rural export sales. But producers have been relatively successful in redirecting exports elsewhere.
The backdrop is one that is supportive of farmland values, the major asset underwriting the rural sector. Farmland prices (per hectare) tend to follow rural commodity prices (Chart 24).
Disclaimer:
This report provides general information and is not intended to be an investment research report. Any views or opinions expressed are solely those of the author. They do not represent financial advice.
This report has been prepared without taking into account your objectives, financial situation, knowledge, experience or needs. It is not to be construed as a solicitation or an offer to buy or sell any securities or financial instruments. Or as a recommendation and/or investment advice. Before acting on the information in this report, you should consider the appropriateness and suitability of the information to your own objectives, financial situation and needs. And, if necessary, seek appropriate professional or financial advice, including tax and legal advice.
This report was prepared by Michael Blythe, Chief Economist at PinPoint Macro.


