iPartners inFocus - Inflation Do We Need To Worry?
inFocus with Michael Blythe (By Michael Blythe, 5th October 2021)

Download here: iPartners inFocus Inflation.pdf
Inflation: do we need to worry?
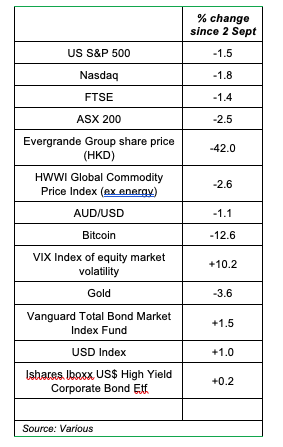
Financial markets suddenly look to be dangerous places! There have been substantial moves across a range of markets and asset classes in September. From an investor perspective, Table 1 gives something of an eclectic snapshot of the story since the S&P500 index peak on 2 September:
Safe havens like the US Dollar and US Treasury’s have benefited:
Interestingly, private credit instruments like high-yield corporate bond ETF’s are little changed. Commentators have advanced several explanations for the market gyrations. These are typically post-event rationalisations. (And I’m doing the same). There is a focus on the problems of highly indebted Chinese property developer, Evergrande. There are broader concerns about the economic outlook and the impact of the pandemic. Fears that the monetary authorities will “taper” their extraordinary policy stimulus resurface every time central bankers meet. There are narrower concerns hanging over some markets - such as falling iron ore prices in Australia’s case and the Government Debt Ceiling in the US. The resultant “fear” has seen measures of investor sentiment deteriorate sharply. The AAII US Equity Table 1: Selected Markets
Market Bull-Bear Spread is back down to where it was at the height of the pandemic panic in 2020 (Chart 1). Unlike then, however, US investor allocation to equities remains essentially unchanged. It seems that when it comes to putting money on the table, investors still have faith in the economic outlook and the ability of policy makers to deal with problems as they emerge. Economists always want to tie everything back to the fundamentals. And financial markets do have to respect the economic fundamentals over the longer run. The one “fundamental” that neatly unites all the current market concerns is inflation. The Evergrande business model seems to rely on ever-inflating land prices. The pandemic has impacted on supply chains and prices. Central banks are, after all, charged with meeting inflation targets. Falling iron ore prices are an example of deflation. The higher interest rates that accompany rising inflation are typically not welcomed by bond holders. Why do we worry about inflation? Everyone knows from Economics 101 that inflation measures the rate of change of prices. Those that made it to Economics 102 will know that inflation is the force that erodes the purchasing power of money. Central banks were created in large part to preserve the value of the currency. Enshrined in the RBA Act, for example, is the duty to pursue “the stability of the currency of Australia”. So the key reason financial markets worry about inflation prospects is what it might mean for policy settings. The interest rates that form the main policy tool to control inflation are also the key to valuations and pricing across all financial markets. Uncertainty about inflation prospects and policy responses can also add to financial market volatility. Bond yields, for example, tend to lift with measures of policy uncertainty (Chart 2). In contrast, low and stable inflation contributes to financial system stability. There are other longer-term issues with inflation beyond the base concerns of financial markets. Continuing on to Economics 103, economists know that there is a trade-off when it comes to controlling inflation:
The higher interest rates used to try and lower inflation rates work partly by slowing the economy. Job losses typically follow (Chart 3 – shows the change in unemployment associated with a change in inflation rates over time). Sometimes policy settings are too tight. Or held at peak levels for too long. The early 1990s recession, for example, is widely attributed to overly-tight monetary policy settings. The recovery after the global financial crisis is widely seen as hampered by a too-rapid withdrawal of policy stimulus (especially in Europe). The trade-off also contributed to the idea of the Misery Index as a policy indicator (Chart 4). The index is the sum of the unemployment rate and the inflation rate. The degree of “misery” in Australia was quite high in the ‘seventies and ‘eighties. But the long-running, low inflation expansion from 1991-2020 reduced our economic pain. And the Misery Index has disappeared from the analyst’s tool kit. Nevertheless, its worth remembering that Australia is well placed, even in these miserable times. There are also dangers in letting inflation rip. Inflationary spirals can develop as wages chase prices higher. These spirals are hard to escape without a recession. They erode and discourage savings. Consumers want to buy now and beat the price rises. At the extreme lies hyperinflation. The problems faced by Germany in the 1920s are well understood. More recent examples include the use of (worthless) Zim dollars as toilet paper. And Venezuelan thieves declining to steal the (worthless) local currency – preferring the greenback to the bolivar. High and persistent inflation rates can also distort investment decisions. The preference shifts to assets that are likely to appreciate in value or are a better store of value like gold. Businesses impose higher hurdle rates when evaluating projects to compensate for the uncertainty. As a result, the nation’s capital stock is smaller and its composition distorted. Potential growth rates are lower and unemployment is higher than otherwise. Higher inflation rates typically mean higher interest rates. But high inflation can also mean a weaker currency. Higher inflation rates relative to the rest of the world makes exports less competitive and imports more attractive. Demand for the local currency falls and supply increases. The “price”, or the exchange rate, falls as a result (Chart 6). There are distributional consequences of high inflation. Those on fixed incomes are more exposed to rising prices. Wage earners, in contrast, have some ability to lift incomes. The distribution aspect highlights that some groups benefit from higher inflation. Inflation erodes the real value of savings. But it also erodes the real value of debt. The interaction with the tax system can magnify the preference for debt in high inflation times. Savers are taxed on their nominal interest earnings. Debtors can deduct their nominal interest payments. While they would never admit it, governments find life a bit easier when a small dose of inflation is greasing the wheels. Like other debtors, inflation reduces the real value of government debt. Those very high debt: GDP ratios in most countries after WW2 did not fall because the debt was repaid. They fell as inflation increased the size of nominal GDP (Chart 7). High inflation may come with some costs. But no economist (or central banker) would argue in favour of zero inflation or deflation. Some inflation is necessary to allow relative prices to adjust. These relative price shifts are an important signal to consumers on where to spend. And they are an important signal to investors on allocating resources to the most productive end. Some inflation also provides a buffer against the economy slipping into a deflationary spiral. Deflation is “bad” for much the same reasons as inflation. It distorts economic signals and the economy. Consumers defer spending because it will be “cheaper” tomorrow. The real value of debt increases. The monetary authorities struggle to get real interest rates into negative territory when stimulus is required. You may hear economists talks about “good” deflation. That occurs when prices fall due to technological innovation or productivity improvement (rather than excess supply). The fall in prices of big screen TVs and computers are examples. Inflation: where are we now? Inflation rates have lifted in many countries and regions in recent months (Chart 8). Australia’s inflation rate, for example, is nearly 3 percentage points above where it was at the end of 2020. Similar lifts are evident in Canada, the Eurozone, and the UK. US inflation rates have lifted by nearly 4%. As a result, inflation is running above central bank targets for the first time in years (Chart 8). The exceptions are China and Japan where inflation rates remain well short of target. Central bank rhetoric has shifted a little as inflation rates have lifted. But policy makers are careful to stress that the change in rhetoric reflects confidence in economic activity as much as any concern about inflation. The US Fed, for example, notes that “indicators of economic activity and employment have continued to strengthen”. And while inflation has lifted, the rise is “largely reflecting transitory factors”. Financial markets have adopted a similar approach. US Treasury yields, for example, have lifted in line with the rise in US inflation momentum. But not to the full extent implied by latest inflation readings (Chart 9). Even the Norges Bank, the only G-10 country to lift policy rates in recent times, pointed to a strong upswing and a “normalising” economy as justification for the rise. The broader community is, however, exhibiting greater concern. Google search activity related to “inflation” has lifted. And is running well above average levels at present (Chart 10). A similar outcome was evident at the height of the global financial crisis in 2008-09. It seems households tend to equate extreme policy stimulus with rising inflation risks. This observation probably explains why measures of consumers inflation expectations have lifted in many countries. Inflation: is the trajectory changing? Central bankers and financial markets are treating the lift in inflation rates in 2021 with caution. They are placing a lot of store in what economists like to call “base effects”. The argument is that prices were held back in the first half of 2020 as the pandemic raged. These artificially “low” price outcomes from last year are now dropping out of the annual inflation rate calculations. The acceleration in inflation right now is overstated as a result. If nothing else this line of argument means we need to disentangle underlying inflation trends from any COVID impact. Fortunately, the heavyweight economists at central banks have done the leg work for us. The US Fed has divided their core inflation measure into two groups: COVID-sensitive and COVID-insensitive.
The calculations show that most of the lift in core US inflation rates reflect the COVID-sensitive component (Chart 11). The contribution from COVD-insensitive inflation remains little different from the pre-COVID period. Another Fed analysis divides the US CPI into those components that respond to the overall economic cycle (Cyclical inflation). And those components that are more reflective of industry-specific factors (Acyclical inflation). The breakdown shows most of the inflation lift reflects industry-specific factors (Chart 12). This outcome fits in with the idea that COVID-related factors are distorting inflation rates at present. A final piece of comfort comes from yet another dissection of the US CPI. Fed researchers have split the CPI into a flexible price group and a sticky price group. The idea is that “flexible” inflation reflects the price changes in CPI groups that change frequently. These prices should be more responsive to economic conditions. They should provide an early warning sign that the inflation trajectory is changing. “Sticky” inflation, in contrast, reflects prices in CPI groups that don’t change very often. The belief is that price changes in this group should reflect longer-run inflation expectations. The breakdown shows the inflation lift has come through the flexible CPI (Chart 13). Again, this outcome fits in with the idea that COVID-related factors are distorting inflation rates at present. Where the comfort comes for central bankers is in the relative stability of the sticky CPI (Chart 13). It appears that inflation expectations remain well anchored, despite the lift in consumer survey measures. Policy makers place a significant weight on inflation expectations in their policy deliberations. In summary, to the extent that the US is a reasonable global proxy, it seems current inflation concerns are overdone. Most of the lift reflects COVID-related, industry-specific factors that should be transitory. Inflation expectations remain consistent with policy objectives. Inflation: what could go wrong? The key fundamental inflation driver is labour costs. COVID, and the policy response to it, have also distorted measures of labour cost growth. The overall picture, however, is one where wage pressures remain moderate. The key to labour cost trends is the labour market. It is where labour demand and supply balance out via the unemployment rate. It drives job security fears that feed back into wage negotiations. Labour market recovery is well advanced in some countries. Employment has returned to pre-pandemic levels (Q4 2019) in Australia and Japan (Chart 14). But wage pressures remain muted. And there is still a long way to go in many other countries. Full recovery is not expected in the US and UK before the end of 2023. Bottom line: rising labour costs are unlikely to underwrite a sustained increase in inflation any time soon. So where is the inflation risk? One of my early mentors in financial markets used to say, “you never see the bullet that takes you out”. And from that perspective the inflation risk seems to come from those drivers that are no longer to be seen. There are three areas to watch:
Inflation in the Australian context The Australian inflation story closely mirrors that of the global economy. Inflation rates have lifted since the end of 2020. Headline inflation is running above the RBA’s 2-3% target band (Chart 8). But much of the lift reflects COVID-related factors and so should prove temporary. The labour market has recovered more quickly than expected. But any flow through to fundamental inflation drivers like wages is hard to see. Business surveys do suggest that China, the digital economy, and supply chain issues are upside inflation risks. An ABS survey reports that 37% of Australian businesses are experiencing supply constraints to “a great extent”. And 34% have increased prices of goods and services as a result (Chart 18). Australia’s inflation rate currently stands at 3.8%. Of that, nearly two-thirds reflects factors that relate back to COVID in some way. For example, policy measures such as the unwinding of earlier childcare subsidies and higher medical costs (Chart 19) have contributed. As has the recovery in fuel prices post the COVID-related slump in oil prices. Higher tobacco taxes – a policy decision unrelated to the economic cycle – also had a significant impact. Stripping out these factors leaves core inflation well contained at around 1½-1¾%pa. These sorts of calculations explain why the RBA can remain upbeat about Australia’s medium-term economic prospects while projecting only a modest lift in inflation (Chart 20). How will central banks view any lift in inflation? As discussed at the start, the link from rising inflation to inflation-target-breach to higher interest rates is well understood. And that is the way the world worked for many years. What is noticeable about more recent times is a shift in the way central banks are portraying their policy reaction functions. Some examples include:
The message seems pretty clear. After undershooting inflation targets for an extended period, central banks will not leap in to crush any incipient signs of higher inflation. This conclusion holds all the more in an environment where much of the lift in inflation rates during 2021 reflects transitory, COVID-related factors. Interest rates are set to remain low. In Australia’s case, the RBA is unlikely to shift from its policy mantra that the preconditions for higher rates are unlikely to be met before 2024. Meanwhile I’m off to book a haircut before prices rise! | 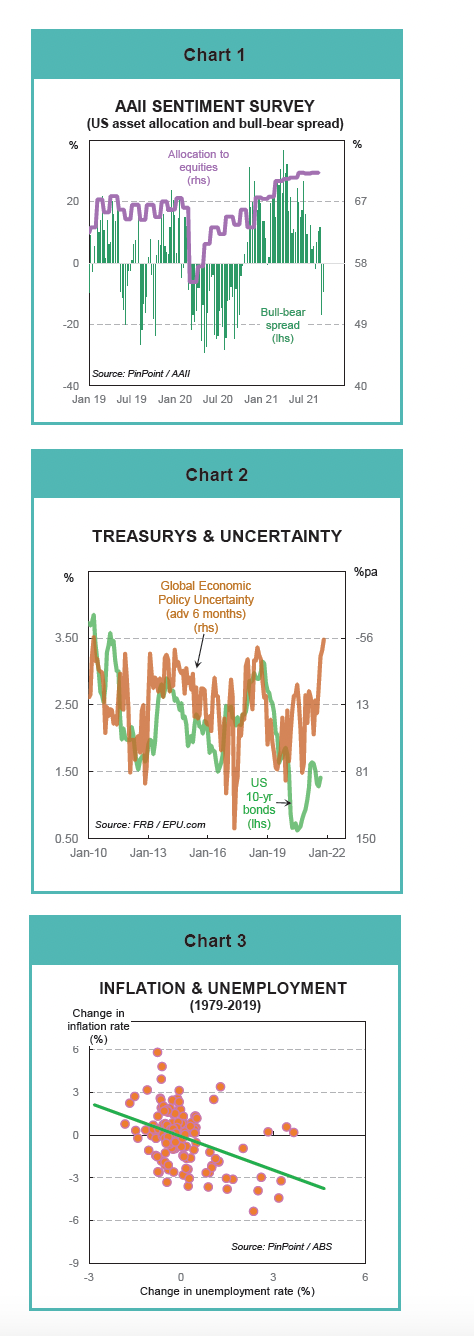 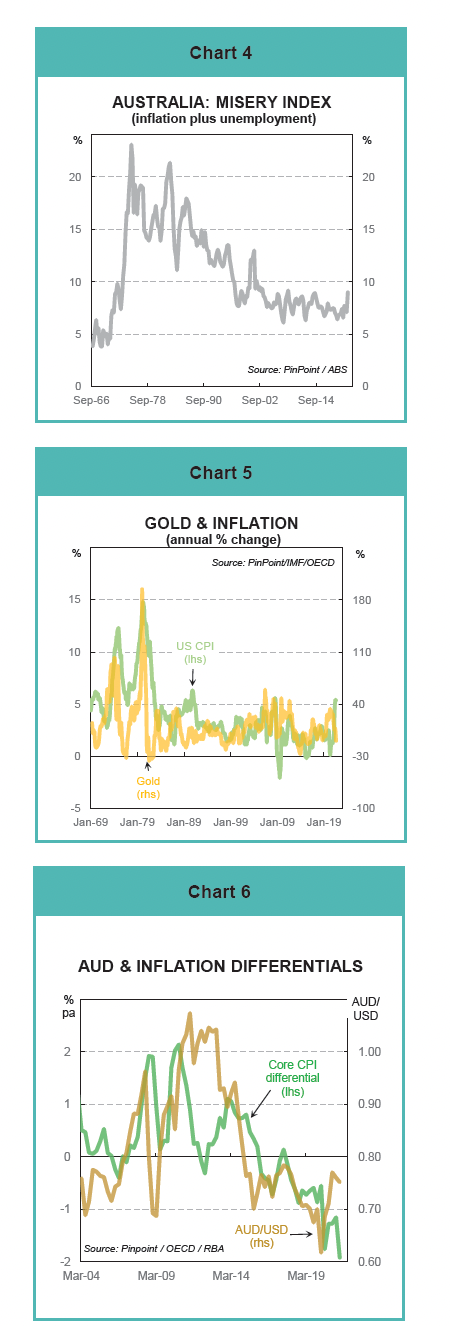 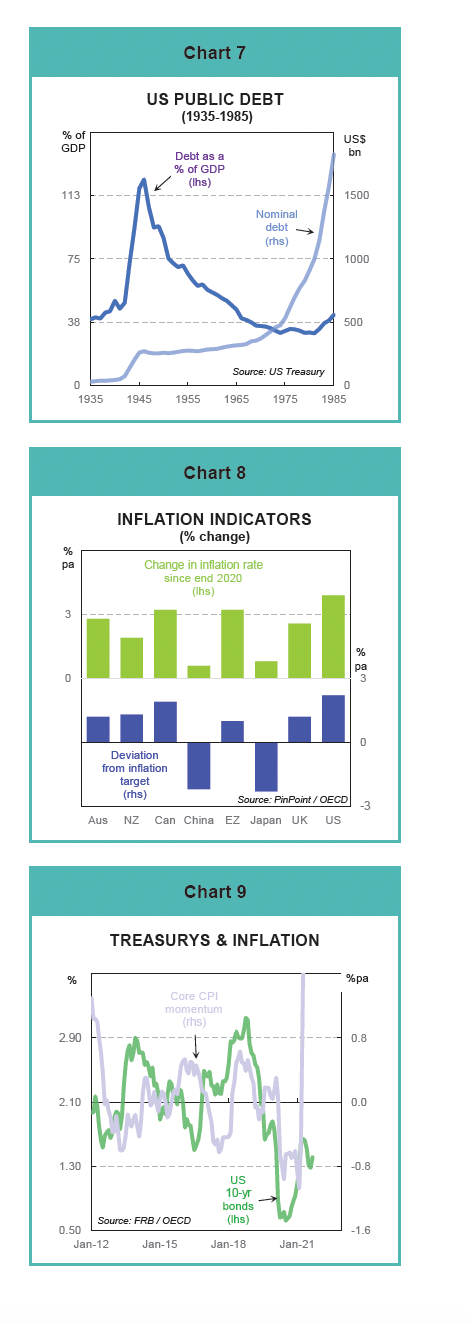 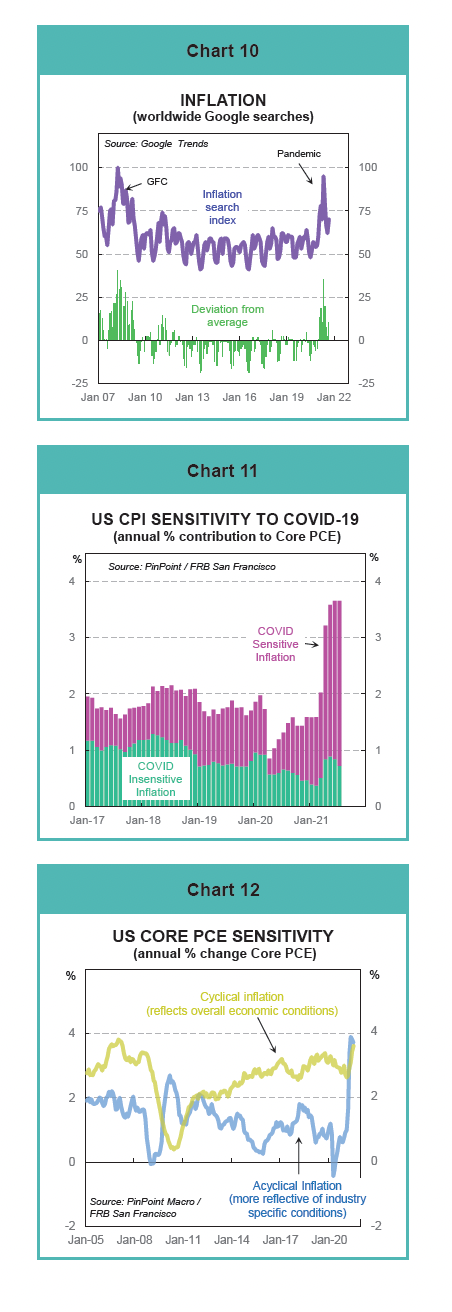 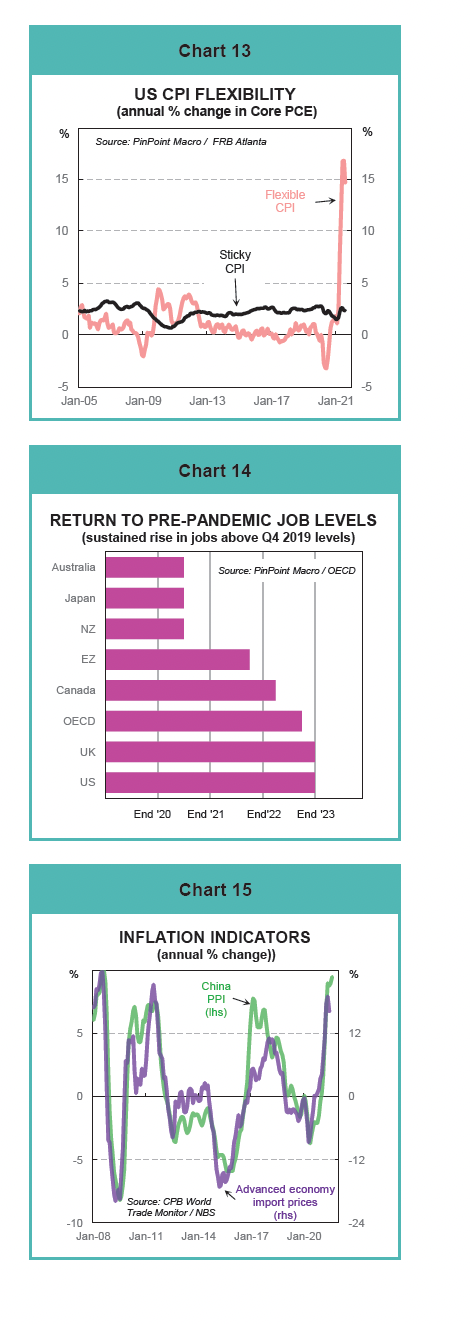 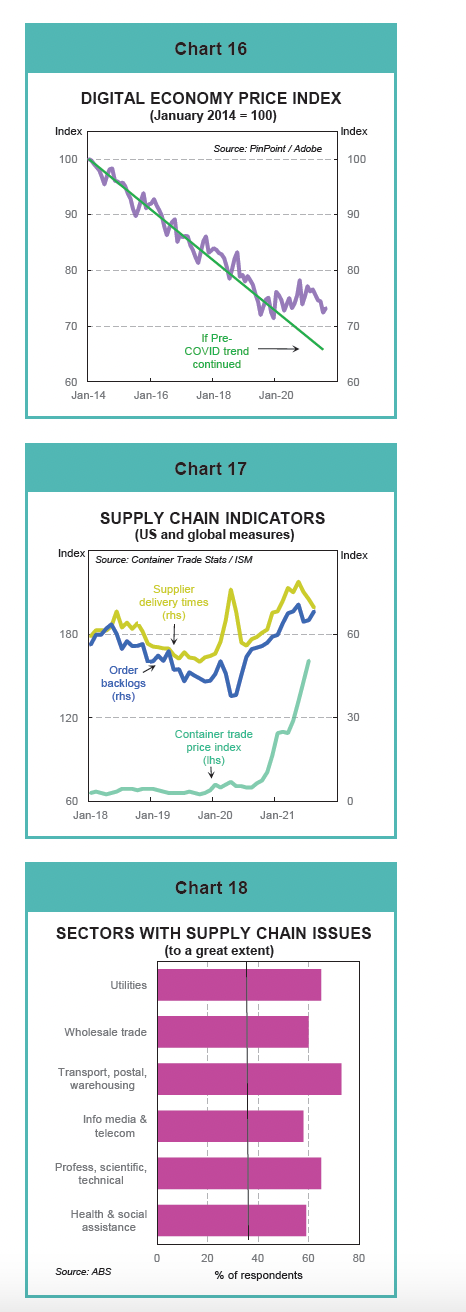 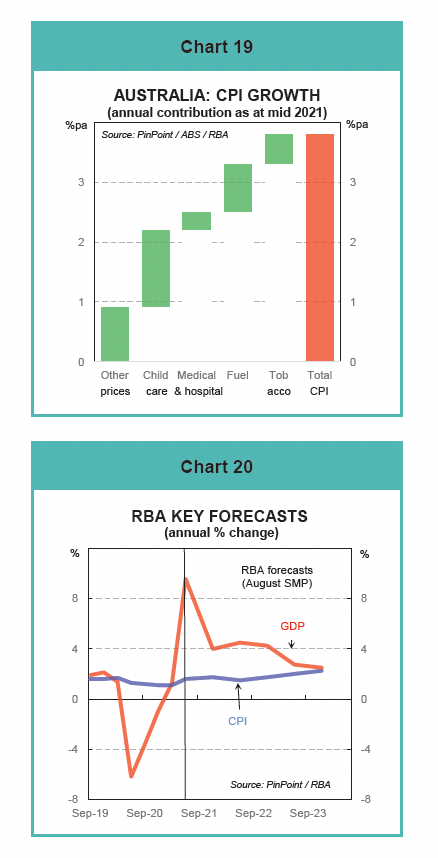 |