iPartners inFocus - Climate Change
The weather, the economy & markets (By Michael Blythe, 4th December 2021)

iPartners inFocus - climate change Dec2021.pdf
- Climate change has steadily moved up the ranks of what worries households and business.
- The debate is contentious. So we should beware the prophets of doom. And the climate sceptics.
- Greenhouse gases rise with income. But there is a tipping point where they begin to fall.
- Falling prices for renewables are helping drive a transition.
- Climate change comes with financial risks and could threaten financial stability.
- But the response to climate change opens up investment opportunities across all asset classes.
“The weather” is always a reliable conversation starter. It’s a neutral topic. There’s a lot of it. We’re all in it. And we all have a view.
The weather conversation has been elevated to an art form in the UK in particular. According to recent surveys, 38% of Britons have spoken about the weather in the past hour and over their lifetimes will spend 4½ months on the topic!
At some point, however, “the weather” moved from that safe, neutral conversational icebreaker to something much more emotive. Weather is now often equated with the debate about climate change. And we have gone from Oscar Wilde’s view that weather talk was “the last refuge of the unimaginative” to Kevin Rudd’s view that “climate change is the greatest moral challenge of our time”.
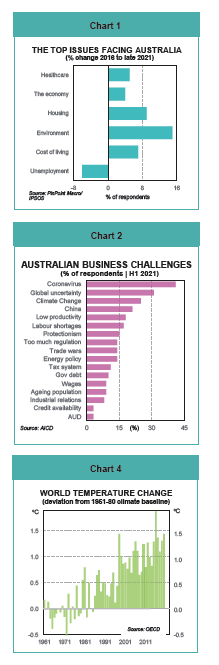
Australia has fully participated in the global trend that has seen climate change steadily move up the ranks of what worries households and businesses:
- IPSOS conduct regular surveys to identify the top issues facing households. Concerns about the environment are the biggest mover over the past five years (Chart 1).
- AICD surveys focusing on top business challenges show, not surprisingly, coronavirus and associated uncertainty at the top of the list. But “climate change” still comes in as #3. And it rates well ahead of traditional business concerns such as “regulation”, “tax”, “wages”, “IR” and “credit availability” (Chart 2)
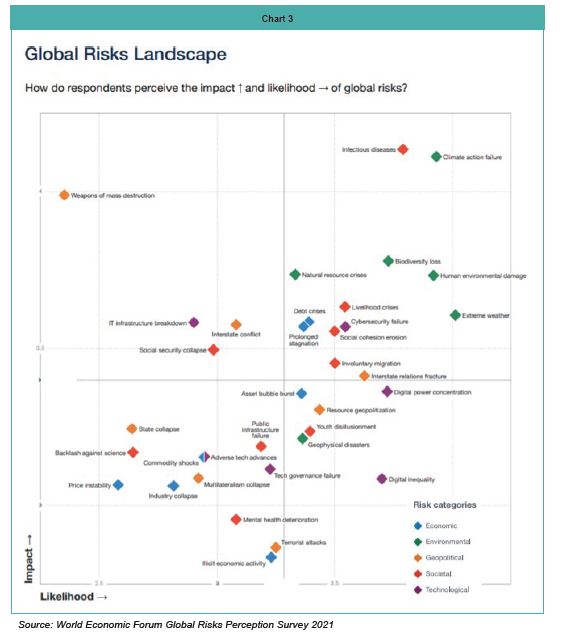
The climate change issue is nicely summarised by the World Economic Forum.
The Forum gathers some of the smartest people on the planet from across the political, business and
cultural spectrum (and associated hanger’s on). They conduct an annual survey on global risks that looks at the likelihood of various events and the expected economic impact (Chart 3).
Environmental issues now dominate the global risks landscape as measured by the survey (green diamonds mark environmental risks on Chart 3). These issues are seen as the most likely to eventuate. And have the potential for the largest (negative) impact.
Climate change: just the facts
Economists like to take out the emotion and put everything into their well-established frameworks. From that perspective:
“climate” is really just the long-run “average” of all those daily weather events that we like to talk about.
Those “weather events” like droughts and floods are really just the “cycle” around the climate average.
“Climate change” represents the “trend” part of the story as climate changes over time.
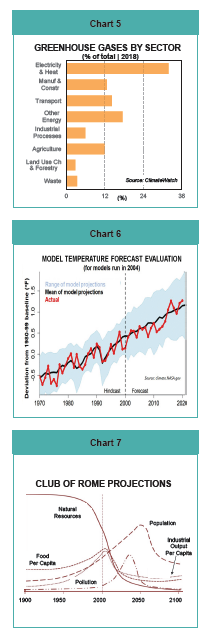
The most common evidence cited for climate change is the increase in global temperatures. Over the past decade, global temperatures have averaged 1¼oC above the 1951-80 climate baseline (Chart 4).
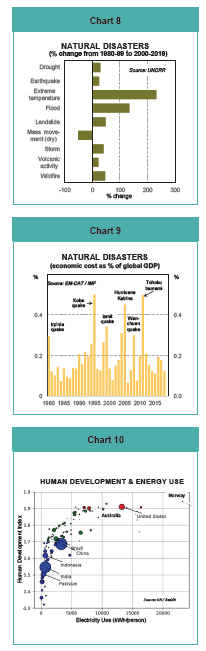
The most common cause identified for that temperature change is the increase in greenhouse gases. These gases act like a “greenhouse”, trapping heat in the atmosphere.
The main greenhouse gases are carbon dioxide (CO2) and methane (CH4). The main sources of these gases are burning fossil fuels for energy and land use.
The main sectors driving emissions are transport, industry, households and agriculture (Chart 5).
Where to from here? Climatologists have clearly taken the economist’s maxim about “forecasting early and forecasting often” to heart. There is a bewildering array of global temperature projections derived from different models using various scenarios. But there is a common theme: temperatures will rise further without action.
Will these forecasts prove correct? There is a long-running joke about the accuracy of weather forecasts. There is an equally long-running joke that God created economists to make weather forecasters look good! What gives pause for thought, however, is an examination of the track record of climate models.
NASA, for example, notes a study that looked at the increasingly sophisticated model projections for global average temperature developed between 1970 and 2007. The study results reveal most of the models were quite accurate in their projections for the following decade or so (Chart 6).
The consequences of climate change are generally accepted as negative via its impact on food production, economic output and general wellbeing. The transmission channels come through damage to ecosystems and biodiversity. And more, and more extreme, weather events.
Beware the prophets of doom
Many of the climate change projections and outcomes are alarming. But we should be wary of excess pessimism.
Early demographic debates, for example, focussed on the size of the population and its implications. The conclusions were typically gloomy. The Club of Rome famously projected back in 1972 that prospective economic and population growth would deplete Earth’s resources and cause economic collapse around 2070 (Chart 7).
Fortunately, those projections proved wide of the mark. We found ways to support a much larger population than previously expected. Climate change offers the same opportunities.
Beware the climate sceptics
Equally, we should be wary of the calls made by the sceptics, deniers and conspiracy theorists.
Y2K provides an interesting analogy. For those in the Gen Z cohort, Y2K was a belief that an historical problem in computer coding would create havoc at the start of the year 2000. In the event, not much happened. And arguments started about whether the risks had been greatly exaggerated. But avoiding the disaster largely came about because of the effort put in to minimise the risks.
There is also a message in the trends in natural disasters.
Natural disasters are, unfortunately, relatively frequent. Data from the Centre for Research on the Epidemiology of Disasters (CRED) identifies 7,348 disaster events over the 2000-19 period. These events claimed an average of 60,000 lives per annum and had an accumulated economic cost of US$2.97 trillion.
The data shows that the number of disaster events is increasing. This trend is particularly evident for weather-related events like floods, storms and wildfires. The global number of floods classified as natural disasters over the 2000-2019 period, for example, was 134% higher than the previous 20 years (Chart 8).
The data also shows the economic damage of natural disaster averages out at 0.21% of global GDP each year. But periods of peak natural disaster such as the Tohoku Tsunami in Japan in 2011, involved damage bills of more than 0.5% of global GDP (Chart 9).
To put those costs into some perspective, it’s more than the US$175bn of annual spending required to eradicate global poverty according to the experts.
Climate change & equity
The climate change debate is often couched in terms of intergenerational equity. Older age groups are perceived to have contributed more to the problem and are resistant to change. Younger age groups will be left to deal with the problem and pick up the tab.
Global surveys show there is a tendency for younger age groups to give a greater weight to protecting the environment than economic growth. But the same surveys show the gap is narrowing.
The equity issue that will be harder to resolve is the variations between countries by stage of economic development. The correlation between development and energy consumption makes the point (Chart 10).
The UN’s Human Development Index (HDI) is based on life expectancy, education and per capita income indicators. The HDI is a simple tool to rank countries in terms of desirable human development.
About 60% of greenhouse gas emissions come from ten countries. (Australia comes in as #15). Most greenhouse gases from this high emission group come from countries with large populations but a low HDI rank like China, India, Indonesia and Brazil. Improving the HDI ranking of these countries requires more energy input. And increasing emissions as a result. Alternatively, limiting emissions to slow climate change would prevent these countries from closing the development gap with the advanced economies.
Resolving this dilemma is a crucial part of the climate change agenda. And there is a cost. That impost is the direct cost of emissions reduction strategies, the transfer cost as richer countries provide funds to help the transition in poorer countries and the opportunity cost of growth foregone to meet emissions targets.
The numbers attached to these costs are “large” to say the least. The International Energy Agency (IEA), for example, estimates that the global energy industry would need to lift its capex to US$5trn per annum by 2030 to achieve a transition to net zero emissions. Developed nations have promised US$100bn per annum of funding to emerging economies to assist their transition (although they are yet to deliver fully on that promise).
From that perspective, climate change and the policy response to it can be seen as a variation of the classic economic problem: how to satisfy unlimited wants with limited resources.
Climate change & the 3P’s
Economists will tell you that, in the end, it all comes down to the 3-P’s: population, participation and productivity. The size of a country’s population determines the demand for goods and services. The participation of that population in the labour force is a key driver of what an economy can supply. And productivity largely determines the income earned by the population.
Trends in the 3 P’s ultimately drive economic activity, jobs and incomes. They create the wealth needed to fund a country’s longer-run objectives and deal with the longer-run challenges such as climate change. And they provide a framework for policy makers dealing with those challenges.
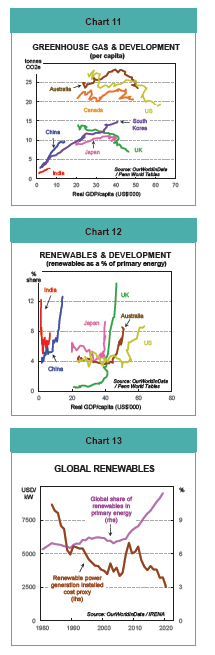
I’ve already highlighted the correlation between development and energy consumption (Chart 10). The other way to think about this is that greenhouse gas emissions rise with income. But this is where the 3P’s come in. There is a tipping point as real incomes approach the US$40,000 per capita mark where emissions start to fall (Chart 11). This seems to be the point where countries are rich enough that the balance between growth and the environment starts to shift.
Emissions start falling at the US$40,000 mark because it is also the tipping point where the renewables share in energy generation starts to lift (Chart 12).
The correlation between incomes and the renewables share also throws up an interesting aberration. The share of renewables in some emerging economies like China and India is already lifting even though they are below the critical income level (Chart 12).
The answer lies with the dramatic fall in the cost of renewable power generation (Chart 13). A proxy for generation costs based on wind and solar power fell by 50% between 2007 and 2020. There was a sharp lift in the global share of renewables over that period.
What we are seeing is another example of the 3P’s at work. Then Saudi Oil Minister, Sheik Yamani, put it most eloquently back in the 1970’s: “The Stone Age did not end because the world ran out of stones…... It ended because bronze tools became cheaper”. In other words, productivity rode to the rescue.
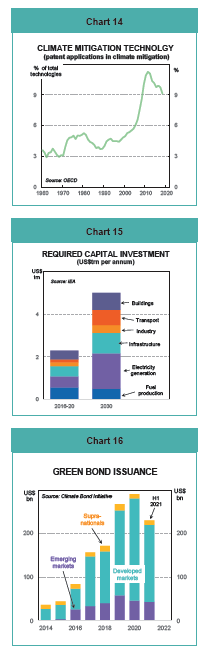
And P-for-Productivity can certainly ease the transition further. One encouraging pointer to rising productivity is the lift in worldwide patents on climate change mitigation technologies (Chart 14). OECD estimates show that the share of “high-value” climate change mitigation inventions in all technologies has increased sharply since the 1990s.
Climate change as an investment opportunity
The large price tag associated with climate change will require a big increase in physical assets, efficiency measures, R&D and a need for finance. Opportunities for investors lie across all these categories.
The IEA estimates of US$5trn per annum of required investment in the energy space by 2030 (Chart 15) gives one example of the possibilities. This overall figure includes spending on infrastructure (US$0.95trn pa), electricity generation (US$1.66trn pa), buildings (US$0.79trn pa) and efficiency (US$0.80trn pa).
These sorts of long-life, regular-cash-flow assets are likely to be appealing to pension funds, banks, private credit, venture capital and equity investors. The funding of these assets will also provide opportunities in the fixed income space.
These investment opportunities have been around for a while now. What is interesting in recent times is the speed of growth.
Some examples of recent trends include:
- Rapid growth in green bond issuance. The first green bond was issued in 2007. And cumulative issuances exceeded US$1trn by the end of 2020. Issuance is still accelerating sharply (Chart 16). These bonds attract what has been called a “greenium”. They price at a higher level than comparable vanilla bonds. For borrowers, this means cheaper debt. On the other side of the equation, investors are prepared to accept a slightly lower yield. This acceptance indicates the strength of demand for green investments. And suggests investors agree with the consensus about the need for emissions reduction and are willing to help.
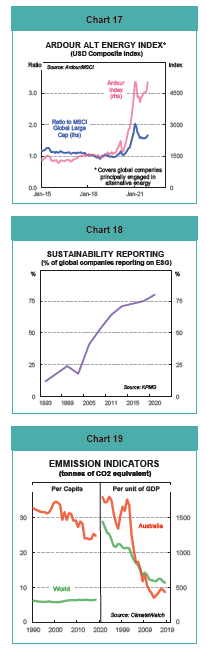
- Rapid growth in the number of companies involved in the green space. Alerian, for example, is a leading independent index provider. They construct a global index of essentially pure-play alternative energy companies (Chart 17). That index shows alternative energy companies have more or less kept pace with the global market overall. But have outperformed in recent years.
- Increasing adoption of green initiatives by existing companies. A survey by KPMG notes that 80% of global corporates now report on environmental, social & governance (ESG) sustainability (Chart 18). The proportion acknowledging the risk of climate change in their financial reporting jumped from 28% in 2017 to 43% in 2020. And over the same period the proportion with carbon reduction targets rose from 50% to 65%.
- An accelerating push by institutional investors to elevate ESG. A survey by Russell Investments shows 82% of global asset managers incorporate ESG considerations in their investment decisions. A recent OECD report notes that low-carbon portfolios are beginning to outperform high-carbon portfolios when it comes to revenue and net profit.
- Support for climate-related innovation is increasing. One indication is the large increase in global venture capital investment in climate-related start-ups - from US$5bn in 2010 to US$30bn in 2020.
There are also some other climate-related issues that investors need to consider. These risks are broadly categorised as physical and transitional.
Physical risks are those that result from climate change. Business assets could be damaged or destroyed, for example, if climate change increases extreme weather events. The OECD estimates that 77% of all disaster-related economic losses over 1998-2017 came from climate-related disasters.
Transition risks stem from changes as an economy moves towards lower emissions. Stranded assets are the key example. These are assets that have their economic life or viability curtailed by technology, regulatory and/or market changes. Fossil fuel assets are often mentioned as an example in the drive to reduce greenhouse emissions.
There are also some implications from these risks for financial stability that worry regulators and other policy makers. Damage resulting from physical risks, for example, also damages collateral used for bank loans. Transition risks can damage company income and valuations, weakening loan collateral and reducing servicing capability.
The potential impact on commodity prices may also have some implication for so-called commodity currencies (particularly the AUD, NZD, CAD and NOK). These currencies tend to cycle around with commodity prices. But a Norges Bank study shows that the relationship between commodity prices and currencies tends to become weaker when climate risk is high.
Climate change & Australia: just the facts
The Australian climate change story is really just a microcosm of the global picture. The two key exceptions are that Australia sits well above the global average for greenhouse gas emissions per capita (Chart 19). But sits below the global average for emissions per unit of GDP produced.
Australia is often portrayed as one of the “bad boys” in the climate change debate. A lot of that debate focuses on per capita emissions. And Australia does look “bad” on that comparison. But the debate should also acknowledge that Australia’s per capita emissions have fallen a long way over the past couple of decades. And it should acknowledge that Australia’s economic growth overall is less emissions intensive than the rest of the world.
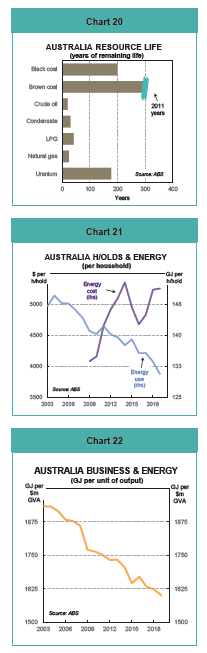
The debate should also reflect some of the things that make Australia “different”. The key is Australia’s resource endowment – mining and agriculture. Australia has a lot of both (Chart 20)
Mining and agriculture are significant parts of the Australian economy (13% of GDP). Mining accounts for 15% of emissions and agriculture a further 11%.
Economists have always argued that countries should play to their comparative advantages. That is the path to job creation and rising living standards. Part of our comparative advantage lies in mining and agriculture. As a result, Australia’s emissions intensity is higher than other countries that specialise in less emissions-intensive industries like services.
In the way the accounting works, Australia is producing emissions on behalf of those countries who buy our exports. These importers have effectively “outsourced” some of the emissions embodied in their own economic activity.
The other “critique” of Australia in the climate debate is the policy response. Or perceived lack of it. Our climate targets are not seen as ambitious enough. Our lack of an energy policy is widely criticised. But there are some interesting lessons from the Australian experience. These are:
- A government leading the way might help – but it’s not essential.
- A price on carbon might help – but the price mechanism is working in other ways.
Australian households and businesses have not waited for governments to tell them what to do. They are responding to the price signals on offer.
Australian households regularly identify rising energy costs as a source of concern. It’s part of the “pain spend” that has far-reaching impacts on household ability and appetite to spend. The pain spend is essentially spending on those items that we must do but don’t enjoy. Fuel, utilities, school fees, rent, health & other insurance are examples. Rising spending in these areas limits the ability to spend elsewhere. And has a negative impact on consumer sentiment. These items are also often a source of upward pressure on the inflation rate.
Households have responded to rising energy costs by cutting energy consumption. They have become more efficient in the use of energy (Chart 21).
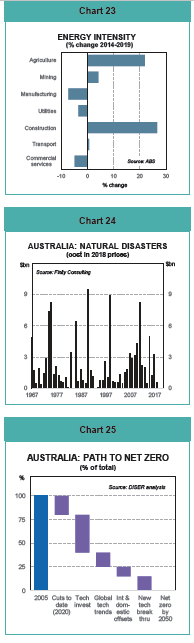
Australian business regularly complains about the uncertainty generated by the lack of an energy policy. But the bigger driver of business decision making over the past decade is the lack of pricing power. The focus has shifted to cost control. And containing energy costs was one part of that shift. The energy intensity of industry has fallen sharply (Chart 22). The falls since 2014 are concentrated in manufacturing, utilities and commercial services (Chart 23).
The same drivers have seen a significant increase in use of renewable energy by households and business (Chart 12).
Like the rest of the world, climate change is also impacting on the prevalence of natural disasters in Australia. The data shows the most prevalent form of natural disaster is floods and storms, as in the rest of the world. But the data is dominated by big events such as the Sydney hailstorm (1999), Black Saturday bushfires (2009) and the Brisbane floods (2011). In recent years the cost of disasters has ranged from $1-10bn per annum (Chart 24).
Like the rest of the world, the Productivity component of the 3P’s will be an important part of the climate solution for Australia. Indeed, the government’s own modelling work shows technology investments (new and potential) is a key component of Australia’s path to net zero emissions by 2050 (Chart 25).
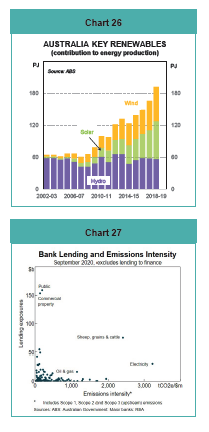
Like the rest of the world, climate change offers a range of investment opportunities. And like the rest of the world, a lot of these come from the shift towards renewable energy. Renewable energy output is still a relatively small share of the total. But it is growing rapidly (Chart 26). According to Climate Bond Initiative (CBI), almost half of the projects in Infrastructure Australia’s Infrastructure Priority List meet international investor definitions of “green”.
More broadly, these opportunities are available across all investment classes. Green bonds have been issued since 2014. Green loans date from 2017. iPartners Koala Farmland Fund is an example of the private credit possibilities. A Morningstar survey estimates that retail assets invested in Australasian sustainable investments stood at $33.4 billion as at mid 2021, a 66% increase on a year earlier.
Corporate Australia is joining the global ESG push. Macquarie Group estimates that 38% of S&P/ASX 200 companies have a net zero emissions target.
Australian financial regulators are concerned about the financial stability implications of climate change. Their concerns relate to physical risks and transition risks. An APRA survey found that intermediaries are taking steps to understand the risks. They are stress testing business models and products and assessing new business opportunities.
Giving some comfort is the observation that majority of lending exposures are to industries that are less emissions intensive (Chart 27). Estimates of climate change impact on house values are relatively small from a bank lending perspective. Insurers, however, are more exposed.
Meanwhile, I’m off to buy an umbrella and some sunscreen!