iPartners inFocus - Australia in 2022: risks & issues
Michael Blythe Considers Expected Economic Outlook for Australia in 2022 (By Michael Blythe, 1st February 2022)

iPartners inFocus - Australia in 2022 risks & issues.pdf
Australia in 2022: risks & issues
Most forecasters expect reasonable economic outcomes in 2022 – but with downside risks.
The pandemic means the path ahead is uncertain, creating challenges for policy makers.
Interest rates should remain low – although off their emergency lows as inflation concerns lift.
Much depends on whether consumers run down their high precautionary savings.
Strong labour markets make this rundown more likely.
A lower terms-of-trade means downside risks to the trade surplus, incomes and the AUD
The past couple of years have provided something of a masterclass for politicians, policy makers and economic commentators on the need for flexibility.
Policy levers were pushed and pulled at frequent intervals over the period. Economists ran out of envelopes on which to redo their forecasts. Politicians vacillated between looking tough and imposing “lockdowns” and gung-ho announcements on “freedom days”.
The pandemic drove that need for flexibility. And it will do so again in 2022.
The IMF probably captured the global zeitgeist the best when it described 2021 as an “arc” from tentative recovery to resurgent uncertainty. Internet search activity makes the point. Google searches show the impact of the successive pandemic waves (Chart 1).
But some perspective is required when thinking about 2021. And some lessons need to be taken from 2021 into 2022.
From the pure economics perspective, 2021 wasn’t that bad. The drop off in OECD economic activity in 2020 was less than feared. And the recovery in 2021 was much stronger than expected (Chart 2).
The OECD puts global GDP growth at 5.6% in 2001. That very solid result follows the 3.4% drop recorded in 2020. A rebound in global trade helped. Unemployment rates fell back quickly towards pre-pandemic levels by year end.
The lesson to take from 2021 comes down to how we interpret the data readings. The Australian labour market is a good example.
Australia’s economic path through 2021 was littered with pandemic-related obstacles. But as often as the economy fell into a pandemic pothole, it also bounced out the other side. So job losses of 356k over August-October were balanced by job gains of 431k in November and December.
The message is to focus on indicators that point to where the economy will end up – rather than the path taken to get to that end point.
The vacancy:unemployment ratio is one such indicator. It balances out labour demand and supply readings. The ratio suggests the endpoint for the unemployment rate is somewhere around 3½% (Chart 3). Australia last had a sub 4% unemployment rate back in 1974. Gough Whitlam was Prime Minister, Richard Nixon had just quit as US President, Cyclone Tracy hit Darwin and some band called ABBA had just won the Eurovision song contest!

The global backdrop
The key themes driving the global economy in the year ahead are set to include:
- reasonable rates of economic growth that should see the advanced economies regain pre-pandemic trends;
- persistent supply bottlenecks, labour market pressures and rising input costs sustaining inflation and creating challenges for policy makers;
- central banks and the fiscal authorities removing some of their extraordinary policy stimulus as a result; and
- risks that remain skewed to the downside.
Inflation pressures should mean higher interest rates (although still low by any longer-run comparison). Fiscal settings will be pushed and pulled by the need to wind back short-term support measures and ramp up longer-term growth drivers. Geopolitical issues will continue to play out.
Forecasts for the global economy come with a tinge of optimism. But the major forecasting agencies fall over themselves to qualify that optimism. The most common descriptors of the global outlook include incomplete, uneven, unbalanced, uncertain and unequal.
The optimism is evident in the numbers. The strong recovery in 2021 is backed up with respectable OECD GDP growth projections of 4½% in 2022 and 3¼% in 2023.
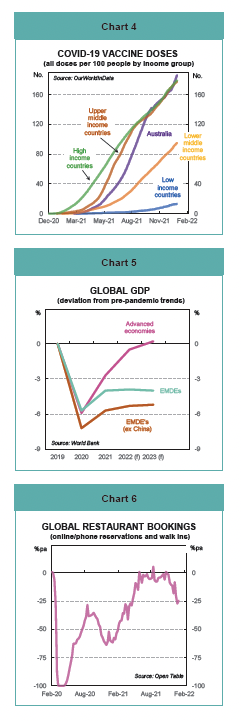
The qualifications to that growth optimism are understandable. The pandemic in all its forms is driving a wedge between countries and sectors. Countries/regions with low vaccination rates are set to underperform (Chart 4). These countries are typically in the emerging and developing world. World Bank projections, for example, show that output in Emerging Market & Developing Economies (EMDEs) will still be 4% below pre-pandemic trends in 2023 (Chart 5). Removing China from the EMDE equation and the shortfall is more than 5%.
The advanced economies are not immune to the pandemic threat. One area to watch closely is the impact on the more people-intensive services sectors in those economies. Governments may be loathe to lock down economies again. But there is some evidence of self-imposed caution emerging. Restaurant bookings, for example, have slowed noticeably with the emergence of the Omicron variant (Chart 6).
This caution is of importance because GDP growth projections rely heavily on spending by consumers and businesses rebounding. This bounce is needed as an antidote to the winding back of public spending that has supported economies until now.
Prospects for consumer spending are encouraging. Wages growth is lifting in some countries. Jobs growth is solid. And the “forced” reduction in spending on services courtesy of lockdowns is unlikely to be repeated.
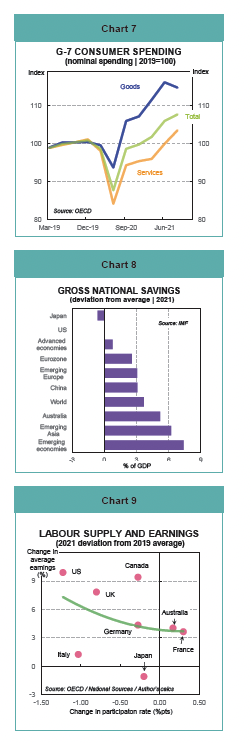
The shift in spending patterns during lockdowns was truly remarkable. In the big G-7 economies, for example, spending on “services” plunged (Chart 7). But spending on “goods” was sustained by the ease of switching from bricks-and-mortar shopping to online.
The other input into the spending equation in 2022 is savings. National savings in many countries and regions is well above average levels (Chart 8). Much of the support to household income provided at the worst points in the pandemic ended up in savings. Running down savings to more normal levels would provide a significant boost to spending.
The labour market is the key. Consumers that are not concerned about job security are going to be more comfortable with their personal financial situation. And should probably lean towards running down their precautionary savings.
One pandemic-twist with implications for the consumer is the shifting balance between labour supply and demand.
Labour force participation rates fell in many countries. This fall is the logical outcome of rising uncertainty and job losses. What looks less logical is the failure of participation to rise in many of those economies during the recovery phase. The US participation rate, for example, at the end of 2021 was still 1.2 percentage points below its (pre-pandemic) average in 2019.
The other outcome in those countries where labour supply has failed to recover is a pick up in wages growth (Chart 9).
Australian labour supply recovered quite quickly. Labour force participation at the end of 2021 was actually above 2019 levels. This recovery in the supply of labour is an important factor contributing to the ongoing weakness in wages growth (Chart 9).
Beyond the pandemic, supply constraints, inflation and potential for policy errors are key concerns.
Supply constraints come from a number of sources. A dramatic shift from spending on services to goods caught manufacturers short (Chart 7). The rapid recovery post lockdowns saw demand run ahead of supply, further exacerbating the problem. Shipping bottlenecks and a shortage of computer chips turned the screws further. The global car industry was particularly affected. Lower auto production has weighed heavily on countries like Germany, Mexico and Japan.
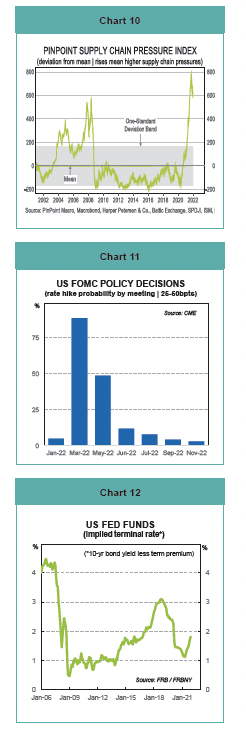
The supply chain pressure index developed by PinPoint Macro is one indicator to watch (Chart 10). It shows supply chain pressures reached record highs late in 2021. These pressures have receded a little but remain high overall.
As any economist will tell you, prices will rise when demand runs ahead of supply. The inflationary impact was accentuated by higher food and energy prices. And by the shifting labour supply-demand balances discussed earlier that lifted labour costs in some countries (Chart 9).
As any market participant will tell you, higher inflation rates mean central banks will have to start lifting interest rates. Indeed, some have already started (BoE, RBNZ, NB).
Financial markets are pricing in higher policy interest rates for 2022. In the US, for example, markets are pricing in a 90% chance of a 25-50bpt rise in the fed funds rate by mid 2022 (Chart 11). Financial markets are also pricing in a terminal, or peak, fed funds rate of 1¾% (from the current 0.13%) (Chart 12).
Inflation is proving more persistent than initially thought. So it is hard to argue against the consensus favouring rate rises. But we should also beware the extreme rates pessimism.
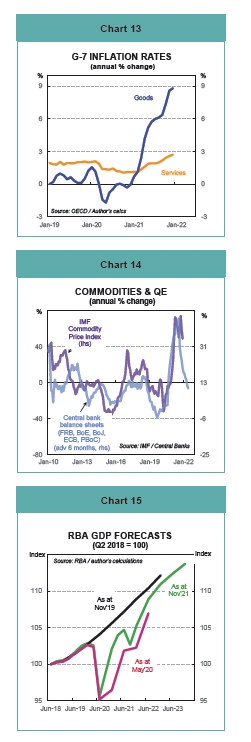
Recovery should mean a return to a more normal distribution between spending on goods and services. There is a nice symmetry in the divergence between G-7 goods inflation and G-7 services inflation that matches the shift in spending patterns (Chart 13).
Supply chains will rebalance. Shipping costs and energy prices have retreated from recent peaks. Inflation rates should peak later in 2022 and then ease back.
Inflation rates in OECD countries are projected to slow from 5% at end 2021 to 3½% at end 2022. Policy makers can afford to be cautious on the magnitude and speed of rates adjustments against that backdrop.
Monetary policy is not just about interest rates any more. The big central banks have sizeable balance sheets courtesy of their quantitative easing (QE) policies. These balance sheets need to be shrunk back towards more normal levels. Concerns about the process are a key factor behind the rise in bond yields around the world. And there are flow-ons to other asset markets as well.
Commodity prices are an example. The global activity backdrop is generally supportive of commodity prices. But the end of QE could generate some downward price pressures (Chart 14).
Some care is also required from the fiscal authorities. Any recovery is an opportunity to commence budget repair. But policy also needs to help sustain growth over the short and medium term. The targets should be investments in education, health and physical infrastructure.
Beyond the risk of policy mistakes, key issues remain the potential risk to Chinese growth from any disorderly correction in the Chinese property market, electricity supply problems in China, lingering issues with the US debt ceiling and risks to do with trade and other geopolitical issues such as the current Ukraine-Russia tensions.
The Australian economy
The Australian outlook closely matches the global backdrop. The pandemic drove a number of potholes into the Australian growth trajectory. But reality was less bad than feared (Chart 15). And the forecasts for the year ahead are encouraging (Table 1).
The Omicron variant will produce yet another pothole in Australia’s growth profile in early 2022. But, as argued earlier, we should focus on the end point rather than how we get there.
From that perspective, the economy grew by around 3% during 2021. And the projections have a solid 5½% growth during 2022 before easing back to 2½% in 2023. The unemployment rate should decline further against this backdrop. The RBA expects unemployment to sit at 4% by mid 2023. They will probably need to revise this projection lower.
The main growth drivers are the bounce back from recent lockdowns in the big States, a high vaccination rate (Chart 4), a reduction in household saving driving a consumption boom, a recovery in business capex, a rural sector boom and ongoing policy support.
The savings rate in Australia is near record highs (Chart 16). On some calculations, “excess” savings stands at around $240bn. This excess is equivalent to 17% of annual household disposable income and 22% of consumer spending. This “rainy day” money is potentially a very powerful support to the overall economy in the year ahead.
The Omicron-related risk here is that consumers retreat into a self-imposed lockdown. While this is a risk, it is hard to see in the high-frequency data.
Information from Google around retail & recreation mobility trends, for example, shows a relatively rapid return to the shops as lockdowns ended late in 2021 (Chart 17). Activity has slowed since then – but it is closely following the seasonal pattern of the previous year. Hard to lay the blame at the feet of Omicron.

More broadly, consumer confidence has held up remarkably well. And job security fears are at decade lows (Chart 18). This is a positive mix for opening consumer wallets.
Business confidence has fallen but business conditions are showing some resilience against Omicron concerns. The surveys are certainly consistent with reasonable growth in business capex in the year ahead (Chart 19).
The close correlations between business and consumer confidence with unemployment highlight again the importance of labour market trends.
As noted earlier, leading indicators suggest we could be looking at a sub 4% unemployment rate in 2022 (Chart 3). There is a real chance that the labour market provides a positive economic shock in the year ahead.
The other positive shock that looks assured for 2022 comes from the rural sector.
Exceptional seasonal conditions are coinciding with a period of elevated rural commodity prices. The government forecasting agency, ABARES, puts the value of rural production at a record $78 billion in 2021/22 (up 15% on the previous year).
Australia is on track to produce the largest volume of agricultural commodities ever recorded.
Trade disputes with China are a threat to some rural export sales. But producers have been relatively successful in redirecting exports elsewhere.
Supply chain issues are just as prevalent in Australia as elsewhere. Lockdowns in 2020 and 2021 meant that spending on “services” collapsed and the focus shifted to “goods”. A construction boom pushed up building materials prices. Higher food, petrol and energy prices added to the inflationary impetus from this mix of drivers. As in many other countries, goods inflation ran well ahead of services inflation as a result (Chart 20).

What is different about the Australian inflation experience is that the acceleration is less marked than elsewhere. And wages are not responding to tighter labour markets in the same way they have in other countries (Chart 9).
Nonetheless, the market has shifted. And the consensus now favours the RBA commencing a tightening cycle later in 2022.
The RBA is fighting a valiant rear-guard action. RBA Governor Lowe is insisting that the Bank will be “patient” and stressing that “the latest data and forecasts do not warrant an increase in the cash rate in 2022”.
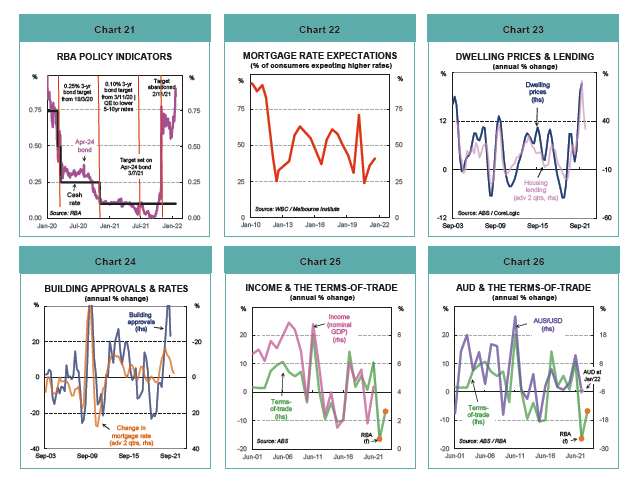
Nevertheless, financial markets have to some extent taken the interest rates decision out of the RBA’s hands (Chart 21):
- The Overnight Index Swap market (OIS), which provides an indication of where financial markets expect the RBA’s cash rate to go, are now pricing in a rate rise later in 2022.
- The RBA was forced to abandon its target for keeping the yield on the April 2024 bond (the 3-year bond at the time) at 0.1%. This target reflected the RBA’s approach to quantitative easing (QE).
- The RBA has subtly shifted the parameters on its bond purchase program. Earlier commentary had the purchases continuing until “at least” February. Now a hard stop looks likely with the Bank to “review” the program.
- Commercial banks have already lifted some lending rates, such as fixed-rate home loans.
So be prepared for higher interest rates. But wherever rates may end in 2022, they will remain low by any historical standard.
The direction of rates is one thing. But it is the level of rates that does the work on the economy.
Central banks will always stress that initial moves on the rates front are not policy tightening. Rather it is about removing some of the policy stimulus. But, once underway, the objective is usually about getting back to some neutral level of rates.
Fortunately, RBA Governor Lowe gave us some idea where the neutral rates lies in Australia back in November 2021. He put neutral as “at least 2.5%, if not 3.5%”.
Any lift in interest rates comes at a time of elevated household debt. Fears about the interaction of debt and lending rates is a long-running feature of the Australian landscape. These fears have always proved unfounded. But higher rates are a risk to housing activity.
There is potential for a “shock” with any rate move. Surveys show the proportion of consumers expecting higher mortgage rates remains quite low (Chart 22). Those same consumers expect further rises in house prices during 2022.
Higher mortgage rates reduce housing affordability. Lower affordability reduces housing demand. And less housing demand can mean lower dwelling prices (Chart 23).
These sorts of considerations are why the research teams at the major banks are uniformly projecting lower dwelling prices for 2023 (down 4-10%). Any fall does, of course, need to be benchmarked against the 30% price rise expected over 2020-22.
Lower affordability is typically a precursor to reduced construction activity as well (Chart 24). The return of students and migrants as Australia’s international borders re-open will provide some offset. But falling construction activity is a significant risk in the growth outlook.
Expectations of solid spending growth sit a little at odds with prospective income trends. The consensus is that key commodity prices will fall in the year ahead. From an Australian perspective that means we should be prepared for a lower terms-of-trade ratio. For the statisticians, this ratio is export prices to import prices. It’s important because swings in the terms-of-trade are the key driver of nominal GDP. And nominal GDP is the broadest measure of income in the Australian economy (Chart 25).
A lower terms-of-trade will cut across some important parts of the Australian economic story.
A falling terms-of-trade generally means a reduction in the surplus on international trade. Historically large trade surpluses helped produce an overall current account surplus for the past couple of years. This surplus is a very rare event. It means that Australia switched from a net borrower from the rest of the world to a net lender. Our exposure to global funding markets was lower as a result. This reduction is a useful protection in volatile and uncertain times. But that protection may be a little thinner from here.
Nominal GDP is also the tax base. So a falling terms-of-trade will weigh on tax revenues. Winding back Australia’s large budget deficit becomes harder as a result. Compounding the issue is the Federal Election due by 21 May. The revealed preference so far is for the government to spend more. The revenue windfall from a stronger than expected economy, for example, was recycled back into spending in the Budget’s Mid-Year Review back in December. Dealing with the Omicron fallout will probably require more spending. And the Commonwealth Budget for 2022 has been brought forward to 29 March, providing scope for even more spending.
Fiscal policy is unlikely to be much of a constraint on economic activity during 2022.
The terms-of-trade is also a summary indicator that captures many of the economic fundamentals that drive the Aussie dollar (Chart 26). A lower terms-of-trade is normally associated with a weaker currency.
Australia has been able to weather the risks emanating from geopolitical concerns, the Chinese economy and policy, as well as skittish financial markets so far. But these risks will persist.
Meanwhile I’m off to the shops to beat the price rises!
Disclaimer
This report provides general information and is not intended to be an investment research report. Any views or opinions expressed are solely those of the author. They do not represent financial advice. This report has been prepared without taking into account your objectives, financial situation, knowledge, experience or needs. It is not to be construed as a solicitation or an offer to buy or sell any securities or financial instruments. Or as a recommendation and/or investment advice. Before acting on the information in this report, you should consider the appropriateness and suitability of the information to your own objectives, financial situation and needs. And, if necessary, seek appropriate professional or financial advice, including tax and legal advice.


